Correlated When it Counts (and Uncorrelated When it Doesn’t!)

Originally published in the Brandywine Asset Management Monthly Report.

One Contributor to Brandywine’s Strong Finish in July
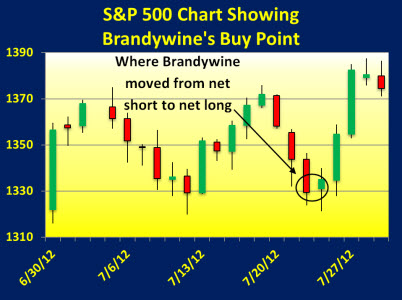
Brandywine’s Symphony program kept pace with the strong performance of the BTOP 50 managed futures index throughout the first three weeks of July. But the big differentiator was the final week, when Brandywine gained while the index fell. One reason for this non-correlation is Brandywine’s use of sentiment- and fundamentally-based trading strategies to trade in stock indexes and directional arbitrage strategies in currencies. The result was that during the middle of the week of July 23rd, Brandywine’s Symphony program shifted from a net short to a net long position in the global stock index markets, enabling Brandywine to profit from the strong month-end rally in equities (this occurred following the statement by European Central Bank President Mario Draghi that the central bank would do whatever was necessary to preserve the euro). While Brandywine had no advance notice that Mr. Draghi would be making that statement, some of our trading strategies recognized that the environment was ripe for a catalyst to trigger short-covering and a market rally. In contrast to Brandywine, trend-following CTAs remained short stock indexes (and net long the dollar), which contributed to their month-end losses.

Benefits of Brandywine’s Fundamentally-based Trading Model: Non-correlation and Consistent Returns
As we stated in last month’s report, Brandywine’s non-correlation is not a result of chance. It is by design. Based on Brandywine’s 30+ years of research and trading experience, Brandywine’s Symphony program incorporates dozens of fundamentally-based – yet systematically applied – trading strategies to trade across more than 100 global financial and commodity markets. Many of the trading strategies employed by Brandywine were developed more than two decades ago and their continued strong performance today proves they are based on sound, logical “return drivers” that have withstood the test of time. (Click here to view a graphical illustration of Brandywine’s allocation across trading strategies and markets).

There is a reason all CTAs are mandated to state that PAST PERFORMANCE IS NOT INDICATIVE OF FUTURE PERFORMANCE. No performance is 100% predictable. There is no better example than that of the U.S. stock market. From August 1982 through March 2000 the S&P 500 Total Return index averaged 19.47% annual returns and suffered just one losing year. But for the subsequent 12+ year period, ending in July 2012, it averaged returns of just +1.25% and suffered two major drawdowns, one that exceeded 50%. The first 18 year period provided no predictability regarding the performance of the second period. There is no mystery why this is so. The reason is quite clear. The performance of U.S. stocks is dominated by one return driver. As Mike Dever shows in his best-seller, for periods of less than 20 years, stock prices are driven primarily by people’s enthusiasm for owning (or not owning) stocks. When people are enthusiastic, prices go up. When they are not, prices stagnate or fall. An “investment” in the U.S. stock market provides no true portfolio diversification. You can read a complimentary copy of that study as it was published in Mr. Dever’s book here: http://bit.ly/xrz2Ur.

But there is a solution that increases the probability that future performance will approximate past performance (although, as we state above PAST PERFORMANCE IS NOT INDICATIVE OF FUTURE PERFORMANCE). That is to create a portfolio that is “truly” diversified across multiple return drivers. Original research conducted by Brandywine in the 1980s led to the Brandywine Benchmark trading program, which traded a diversified portfolio across more than 100 markets and dozens of trading strategies based on disparate return drivers. In further confirmation of the efficacy of those trading strategies, we observed similar performance in the walk-forward testing when we updated the performance of those trading strategies during the 2000s. And now after 13 months of trading in Brandywine’s Symphony program, we’re seeing the continuation of that performance. You can see the past performance of Brandywine’s Symphony, the Brandywine Benchmark trading program and walk-forward testing at brandywine.com.

Earlier this year, due to rapid advances in natural gas extraction by energy companies as a result of the development of “fracking” and the exploration of “shale gas”, natural gas production in the United States reached new highs. As a result, natural gas prices reached multi-year lows. This triggered Brandywine’s fundamentally-based counter-trend strategy to begin buying natural gas as prices dropped well below $3 (MBtu). In a multi-strategy program such as Brandywine’s Symphony, this initially had the appearance of Brandywine “taking profits” on its short position.

The reason for this? The performance of Brandywine’s Symphony program is based on the performance of dozens of independent return drivers. Not just one (such as trend following). Some of these return drivers attempt to capture short-term counter-trend moves based on market sentiment or fundamental pricing relationships in a market or among multiple markets. Others are based on market reactions to events, such as government reports; while still others look at commodity market action in relation to repeatable seasonal activity, such as planting and harvesting periods. As a consequence, no single return driver or individual market dominates the performance of Brandywine’s Symphony program. This results in:

  • true portfolio diversification,
  • non-correlation to other CTAs and traditional investments, and
  • future performance that more closely approximates past performance.
Share this post:
  • Facebook
  • Twitter
  • email
Permalink

Jackass Investing “Poor-folio” Award to Spanish and Italian Market Regulators for Short-Selling Ban

As European stock markets continue to exhibit weakness, Spain’s stock market regulators today banned the short-selling of stocks for the next three months.  Earlier in the day, Italy’s stock market regulators re-instituted a temporary ban on the short selling of financial stocks.

“Selling short” is the process of selling a stock first (by borrowing the stock from a broker) and then buying the stock back at a later date (and returning the stock to the broker) with the expectation of profiting from a decline in the stock’s price.   “Going long” is simply the process of buying a stock with the expectation of profiting from a rise in the stock’s price.

This type of short selling ban by governments is nothing new.  Government regulators in many different countries have often reacted to adverse stock market conditions with similar directives.

This type of action is usually taken by regulators during times of severe market declines with high volatility.  Government regulators think that extreme volatility is a disruption to the orderly functioning of the market, so they often decide to “do something” in order to appease their constituents.

However, it is unrealistic to expect the stock market to only go up, so the prohibition of short-selling during market declines is fundamentally irrational.  Conventional investment wisdom assumes that asset classes are long-only investment vehicles, so it has become accepted that being long is “good” while being short is “bad”.  This is ridiculous.

During extreme market moves to the upside (such as the rally in the US stock market following the March 2009 low, for example), should governments institute long-buying bans to curb extreme market volatility?  Of course not!  You will only see governments act to try to prevent stock market declines, not rallies.

As with most government actions, short-selling bans fail to produce the desired outcome, and oftentimes exacerbate the situation that regulators are attempting to “fix”.  Short-selling bans often have unintended consequences.  As I discuss in Myth #10 of Jackass Investing, short sellers provide the stock market with liquidity when they step in to sell short stocks that become over-hyped by emotional buyers.  In addition, short sellers must buy back stock in order to close their positions, so by instituting short-selling bans, governments essentially remove a source of liquidity during times when the markets need it the most.

Don’t just take my word for it.  Numerous academic studies have also shown the ineffectiveness and potential damage due to short selling bans and have confirmed the positive contribution of short sellers to market efficiency.  In fact, contrary to the intent of governments when instituting such bans, studies have shown that banning short selling reduces liquidity and increases volatility.

“Market Declines:  Is Banning Short Selling the Solution?” by Federal Reserve Bank of New York, September 2011

“Shackling Short Sellers:  The 2008 Shorting Ban” by Boehmer, Jones, and Zhang, September 2009

“Spillover Effects of Counter-cyclical Market Regulation:  Evidence from the 2008 Ban on Short Sales” by Abraham Lioui, March 2010

The belief that short selling destabilizes markets is a myth.

As a result of their ineffectiveness and misguided beliefs, I am awarding a Jackass Investing “Poor-Folio” Award to .  .  . the Spanish and Italian market regulators responsible for instituting short-selling bans.

Share this post:
  • Facebook
  • Twitter
  • email
Permalink

Benefits of Brandywine’s Fundamentally-based Trading Model: Non-correlation and Consistent Returns

Originally published in the Brandywine Asset Management Monthly Report.

Brandywine’s non-correlation is not a result of chance. It is by design. Based on Brandywine’s 30+ years of research and trading experience, Brandywine’s Symphony program incorporates dozens of fundamentally-based – yet systematically applied – trading strategies to trade across more than 100 global financial and commodity markets. Many of the trading strategies employed by Brandywine were developed more than two decades ago and their continued strong performance today proves they are based on logical “return drivers” that have withstood the test of time. (Visit brandywine.com to view a graphical illustration of Brandywine’s allocation across trading strategies and markets).

Diversification Examples
Perhaps the best way to explain the fundamental source of Brandywine’s non-correlation with “traditional” CTAs is to present some specific recent trade examples. In this section we’ll present three specific trades as examples that contributed to Brandywine’s differentiated performance.

The strategies that produced these trades, because they are based on “return drivers” that are distinct from trend following futures traders, also produced differentiated returns throughout the past year. These are three examples out of hundreds of potential examples of Brandywine’s unique trading model and performance. Exposing them is intended to provide you with a better understanding of Brandywine’s diversifying value when included in a portfolio of traditional CTAs.

Fundamentally-based Counter-Trend Strategy in Natural Gas
Although Brandywine is not a trend-follower, we do believe in the efficacy of trend-following. (Mike Dever discusses the value of trend following in chapter 7 of his bestselling book, Jackass Investing: Don’t do it. Profit from it. You can read a complimentary copy of that chapter here: http://bit.ly/wX2ONc). As a result, we have always been skeptical of buy-low, sell-high counter-trend strategies, UNLESS they are based on some sound fundamental principal (are not just a mathematical curve-fit). One fundamental concept that does make sense is using marginal cost-of-production concepts to trade low-priced commodities from the long side in a counter-trend fashion. A trading strategy based on this concept originated at Brandywine in the early 1990s and the strategy continues to perform positively today.

Earlier this year, due to rapid advances in natural gas extraction by energy companies as a result of the development of “fracking” and the exploration of “shale gas”, natural gas production in the United States reached new highs. As a result, natural gas prices reached multi-year lows. This triggered Brandywine’s fundamentally-based counter-trend strategy to begin buying natural gas as prices dropped well below $3 (MBtu). In a multi-strategy program such as Brandywine’s Symphony, this initially had the appearance of Brandywine “taking profits” on its short position.

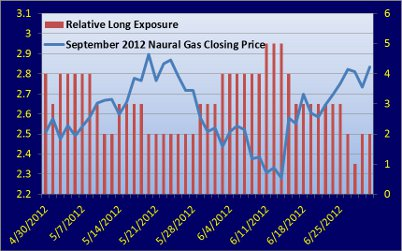
By the end of April however, Brandywine had established a net long position. As natural gas is just one of more than 100 markets traded in Brandywine’s Symphony program, the risk exposure of this trade to Brandywine’s portfolio was moderate, amounting to less than 20 basis points. Throughout May and June, Brandywine incrementally-traded this position several times. The chart below shows the long positions held by Brandywine over the past two months relative to the price of natural gas. The long position (right axis) is risk-based, such that a position of 4 had twice the long exposure as a position of 2. As is evident in the chart, as prices fell our long exposure increased and as prices rose Brandywine took profits on those long positions.

Brandywine’s Fundamentally-based Counter-trend Strategy in Natural Gas
(Long Exposure Relative to Natural Gas Price)

The end result was that during June this strategy produced a net gain of more than 30 basis points for Brandywine’s Symphony program, and it did so in a fashion that was completely uncorrelated to the returns of the other trading strategies employed by Brandywine. This strategy is also expected to be profitable on the majority (in excess of 70%) of its trades, while being selectively “in-the-market” less than 25% of the time. Historically, this strategy has a zero correlation to trend following CTAs.

Directional Arbitrage Trading in Currencies
A second group of strategies that contributed to Brandywine’s profits in June were “directional arbitrage” strategies employed by Brandywine in the currency and interest rate markets. These strategies look at forward curves and price differentials among currency and interest rate markets to establish directional trades based on biases in the data. As these strategies are based on return drivers that are unrelated to those that drive trend-following performance, the performance of these strategies is, on average, uncorrelated to that of trend-following CTAs. There are times, however, where performance can be highly negatively correlated. The last trading day of June was one example of this negative correlation. On that day trend-followers in the currency and interest rate markets suffered greatly as established trends in those markets reversed violently. Brandywine’s directional arbitrage strategies were well-positioned for this reversal and profited. This contributed to Brandywine’s +0.38% gain on June 29th. June 29th was not a one-day aberration however. Brandywine’s directional arbitrage strategies also contributed to Brandywine’s overall positive performance over the past 12 months.

Event Trading in the Dollar Index
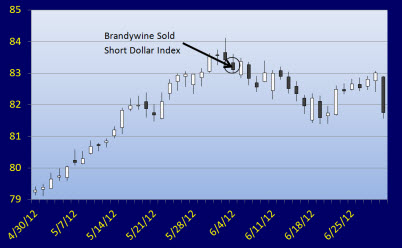
Another unique category of strategies employed by Brandywine are event-based trading strategies. These were developed based on the discretionary trading experience of Brandywine’s founder in the 1980s. The return driver underlying these strategies is based on the fact that various events, such as the information contained in government reports, can trigger significant market moves or trend reversals in affected markets. Under certain conditions that short-term market reaction is predictive of future market direction. Brandywine’s event-based strategies are designed to capture those moves. One such trade, a short position in the U.S. dollar, was triggered following the release of the Employment Report on June 1st. Based on this event and subsequent market factors, Brandywine entered into a short position in the U.S dollar index. As this was an event-based trade, and not dependent on trends, this short position was entered into within days of the market top set on the morning of June 1st. Brandywine remained in this trade at the end of June. As a result of being in this trade, the collapse in the dollar on June 29th provided differentiated profits (compared with the major CTA indexes) for Brandywine’s investors.

Brandywine’s Event-based Trading in the Dollar index

Share this post:
  • Facebook
  • Twitter
  • email
Permalink

The Downside of Non-Correlation

Originally published in the Brandywine Asset Management Monthly Report.

Brandywine employs dozens of individual trading strategies to trade across more than 100 global financial and commodity futures markets. The majority of Brandywine’s strategies are based on fundamental, arbitrage, sentiment, event-driven and other non-trend-following approaches (all systematically-applied). As a result, Brandywine delivers returns that are uncorrelated with traditional trend-following CTAs. (Unfortunately), this non-correlation stood out in May, when the major CTA indexes posted gains while Brandywine lost.

Brandywine’s allocation across trading strategies and markets

As you might suspect (by the fact that trend-following CTAs profited in May), Brandywine’s losses came from trades made by our fundamental, sentiment and arbitrage strategies, while Brandywine’s trend following strategies produced profits.

Brandywine’s profits since the inception of the Brandywine Symphony program in July 2011 are the result of the fact that five out of the six strategy-types employed produced profits. Interestingly, the most profitable strategy-type (comprised of five individual trading strategies) was trend-following. So despite the fact that trend-following CTAs have struggled over the past year, that strategy-type has proven to be the most profitable for Brandywine. What this indicates, is that even within trend-following, Brandywine is doing something different.

Brandywine’s drawdown in perspective
Brandywine’s current drawdown began in March 2011. Over the past three months the cumulative decline has equaled -5.51%. This drawdown, in both magnitude and duration, is about as “average” as it gets. Over the 21½ year test period prior to our start of trading last year, the average of our 21 largest drawdowns (a “one-year event”) was -5.49% and the average length was 3.2 months. This doesn’t mean that our current drawdown is at an end, but it is dead-center among expectations based on our back-tests.

Share this post:
  • Facebook
  • Twitter
  • email
Permalink