
Originally published in the Brandywine Asset Management Monthly Report.
The investment world lives by benchmarks. Every institutional investor benchmarks the performance of the individual components of their portfolio to various indexes. Individual investors do the same. That’s why the financial news constantly refreshes the current performance of the Dow Industrials or the S&P 500. This is partly due to regulatory mandate. In 1998 the SEC began to require mutual funds to show their performance relative to a benchmark. They felt this would better enable investors to determine whether a fund was performing well because of investment decisions made by its manager or simply because of factors outside their control. But mostly, benchmarking is seen as a necessary exercise to determine the effectiveness of a fund’s management team.
As a result of this “benchmark-itis,” we often get asked by investors, “against which benchmark should we compare your performance?” Suggestions include the S&P 500 (because everyone watches that), hedge fund indexes (because our return driver based approach is “non-traditional”), or maybe the CTA indexes (since we execute our strategies in the futures markets).
But none of these are a proper benchmark for Brandywine’s Symphony Program. That’s because Brandywine doesn’t employ trading strategies based on common, “public domain” return drivers. As a result, our returns won’t necessarily have any relationship to any index return. For example, some of Brandywine Symphony’s best-performing periods have occurred when stocks dropped significantly (such as during Q3 2011). And Brandywine shows no correlation of returns to any of the few dozen hedge fund indexes. With regards to CTA indexes, well, this year provides a great example of how uncorrelated Brandywine is. While most of the CTA indexes exhibited losses from January through July, Brandywine produced solid profits. And although Brandywine gained strongly along with the CTA indexes in August, our sharp loss in September was in stark contrast to gains for the CTA indexes. Whether we over- or under-perform relative to any of the standard benchmarks over any period of time is essentially random and irrelevant.
Brandywine’s Benchmark
So what is the best index with which to compare Brandywine Symphony’s performance? It’s our own past performance.
The reason is because Brandywine’s Symphony Program follows a return driver based approach that incorporates dozens of independent trading strategies, each based on a sound logical, non-public domain return driver, to trade across more than 100 global financial and commodity markets. Our goal is to achieve the highest possible return for any given level of risk with a reasonable probability that our future performance will match our past performance. We do not employ a single style that can be reflected in any single index.
Which leads to the question, “how is Brandywine’s Symphony Program performing relative to its benchmark (its own past performance)?” Since September posted the worst monthly loss since Brandywine’s Symphony Program began actual trading in July 2011, we’ll focus on the downside behavior.
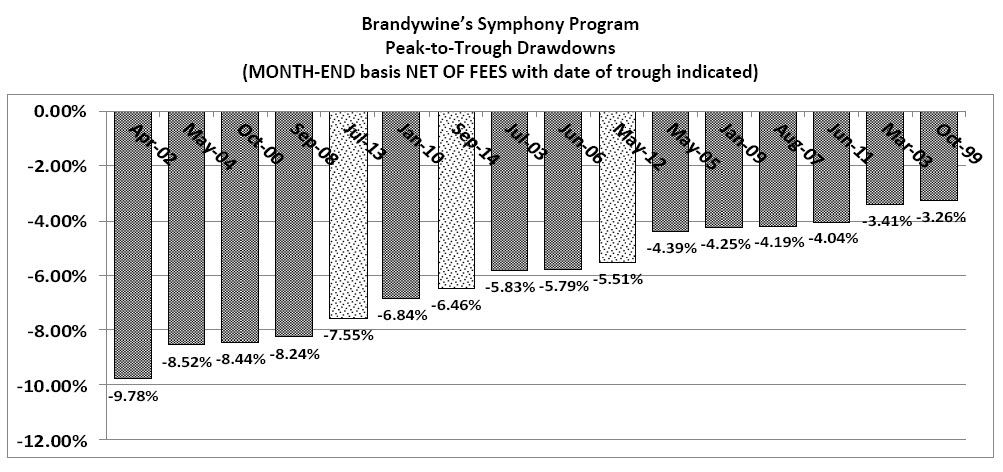
Brandywine’s walk-forward back-test for our Symphony Program runs from January 1999 up to the start of our actual trading in July 2011(1). Virtually all performance tracking services publish an investment program’s maximum drawdown on a month-end basis (measuring the drop in performance across one or more months from the highest month-end peak to a subsequent month-end low). We’ll look at our drawdowns on that basis as well as gross end-of-day performance (which will almost always be larger as it captures intra-month losses and does not receive any benefit from potential incentive fee give-backs).
Brandywine Symphony’s Drawdowns in Line With Benchmark
In the first chart we display the 16 largest month-end peak-to-trough drawdowns (on a net basis) over the past 16 years (this includes tested performance (dark bars) from 1999 through June 2011 and actual performance (light bars) starting in July 2011). We would expect to incur a drawdown within the range of this chart on average once per year, and that is exactly what has happened. Since the start of actual trading in July 2011 we have had three drawdowns make it onto the chart. The most recent drawdown, which has been almost perfectly bracketed by the beginning and end of September (making the end-of-day performance match the month-end performance quite closely), is right in the middle of the range at -6.46% (this also indicates that it could extend an additional 3% and still remain within expectations).
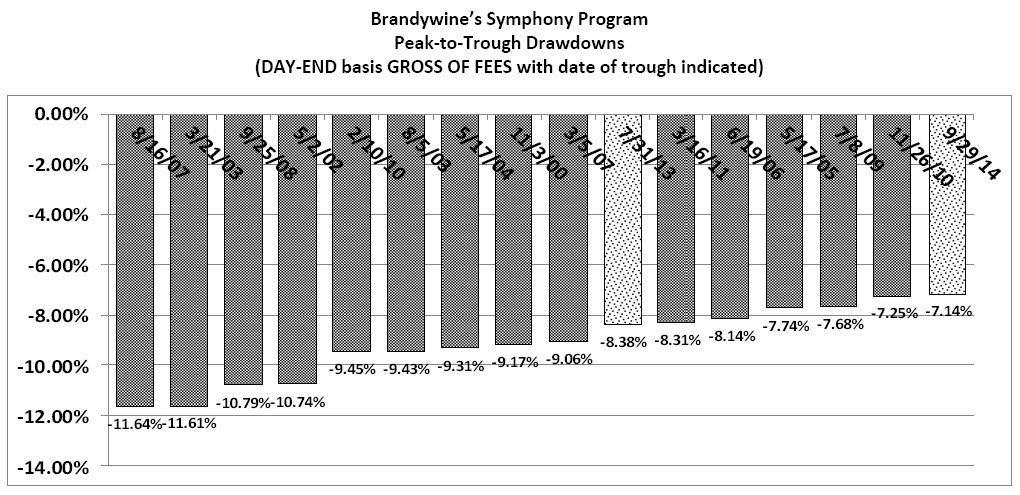
Now let’s look at the 16 largest drawdowns as measured on a gross, end-of-day basis. We would expect a drawdown to fall within this range on average once per year. As you can see in the following chart, the current drawdown, at -7.14%, just made it onto the chart. Since the start of actual trading in July 2011, two drawdowns made the “bottom 16” and neither registered among the worst. So our performance in actual trading has been slightly less “risky” than our benchmark would project.
One final way to view the current drawdown is to compare this past month’s performance to other 22-day periods (the number of trading days there were in September) in our history. In that regard, this is the 5th deepest 22-day drawdown (measuring the worst 22-day period within all past drawdowns) over the past 16 years. This indicates that a drawdown of this size should occur over a 22-day period once every 3 years. Since we just wrapped up 3 ¼ years of trading, this drawdown is right in line with expectations.
Drawdowns are just as much a part of the performance of Brandywine’s Symphony Program (as well as any investment) as are positive returns. The fact that the drawdowns we have incurred in our actual trading so closely match our Benchmark expectations is confirmation that our investment model continues to work as expected. In summary, the performance of Brandywine’s Symphony Program, as measured by the drawdowns we have incurred since the start of actual trading in July 2011, has been faithfully tracking our expectations pursuant to our benchmark, which is our past performance.
(1) Because this report includes the results of the tested performance, in addition to the actual performance, of Brandywine’s Symphony program, the following disclaimer is required:
HYPOTHETICAL PERFORMANCE RESULTS HAVE MANY INHERENT LIMITATIONS, SOME OF WHICH ARE DESCRIBED BELOW. NO REPRESENTATION IS BEING MADE THAT ANY ACCOUNT WILL OR IS LIKELY TO ACHIEVE PROFITS OR LOSSES SIMILAR TO THOSE SHOWN. IN FACT, THERE ARE FREQUENTLY SHARP DIFFERENCES BETWEEN HYPOTHETICAL PERFORMANCE RESULTS AND THE ACTUAL RESULTS ACHIEVED BY ANY PARTICULAR TRADING PROGRAM.
ONE OF THE LIMITATIONS OF HYPOTHETICAL PERFORMANCE RESULTS IS THAT THEY ARE GENERALLY PREPARED WITH THE BENEFIT OF HINDSIGHT. IN ADDITION, HYPOTHETICAL TRADING DOES NOT INVOLVE FINANCIAL RISK, AND NO HYPOTHETICAL TRADING RECORD CAN COMPLETELY ACCOUNT FOR THE IMPACT OF FINANCIAL RISK IN ACTUAL TRADING. FOR EXAMPLE, THE ABILITY TO WITHSTAND LOSSES OR TO ADHERE TO A PARTICULAR TRADING PROGRAM IN SPITE OF TRADING LOSSES ARE MATERIAL POINTS WHICH CAN ALSO ADVERSELY AFFECT ACTUAL TRADING RESULTS. THERE ARE NUMEROUS OTHER FACTORS RELATED TO THE MARKETS IN GENERAL OR TO THE IMPLEMENTATION OF ANY SPECIFIC TRADING PROGRAM WHICH CANNOT BE FULLY ACCOUNTED FOR IN THE PREPARATION OF HYPOTHETICAL PERFORMANCE RESULTS AND ALL OF WHICH CAN ADVERSELY AFFECT ACTUAL TRADING RESULTS.


