Risk Control

Originally published in the Brandywine Asset Management Monthly Report.

It’s not a cliché. The key to successful investing is to control losses. May’s loss is an endorsement of Brandywine’s approach to controlling risk. There were few bright spots in the trading of Brandywine’s Symphony program during May, yet the final loss amounted to just 3% (in contrast, the S&P 500 has lost more than 3% six times in a single day since the inception of Brandywine’s Symphony program in July 2011).

Brandywine controls risk by taking a “top-down” approach that incorporates risk management as an integral requirement in Brandywine’s portfolio allocation model. In contrast, judging by the questions we receive from investors, it is apparent that many other managers control risk by imposing constraints on the positions in their portfolio. These take the form of market and sector position limits, stop-loss limits on trades or overall portfolio stop-losses. It is Brandywine’s belief that if a portfolio allocation model suggests position sizes or permits losses that need to be constrained, then there is a flaw in that model. To correct for those flaws – after the fact – by imposing constraints, is akin to putting earrings on a pig; you can dress it up, but it ain’t pretty.

We can trace this practice (of putting earrings on a pig) back to the start of the modern era of portfolio management, the publication of Harry Markowitz’s “Portfolio Selection” in 1952. When Brandywine began its research into its portfolio allocation model in the late 1980s, we came to recognize the flaws in mean-variance modeling. (Mike Dever covered this topic specifically in his well-received presentation titled “The Fatal Flaw in Mean-Variance optimization” at the QuantInvest conference in New York City in 2012.)

The goal of mean-variance modeling is to create an “optimized” portfolio and it does so by calculating an “efficient frontier,” which indicates the allocations to be made to portfolio constituents in order to achieve the best possible return for any given level of risk (defined as volatility). Many practitioners of this type of modeling realize the output is only theoretical, and often impractical, and this is the reason they compensate for this by modifying the output from their portfolio allocation models by imposing market or sector constraints.

This points out the fatal flaw in mean-variance modeling. It was developed in answer to the wrong question. Instead of asking “how can I get the optimal results given these investment/trade inputs?”, the correct question is “how can I get the most predictable results?”. This was the question Brandywine asked when we began the process of developing our portfolio allocation model in the late 1980s.

After years of researching this issue, Brandywine concluded that the greatest probability that future performance would match past performance could be achieved by establishing balance across the markets and trading strategies employed in the portfolio. The result is that Brandywine’s portfolio allocation model is designed to ensure that, over time, each market makes an equal contribution to the portfolio’s risk. It is this portfolio balance that precludes the need for Brandywine to impose any “after-the-fact” constraints in the portfolio’s positions. It is already in balance as a natural outcome of having asked the correct question when developing the model.

Recently, others have begun to recognize the fatal flaw in mean-variance modeling. This has led to the popularization of “risk parity” investing, which attempts to allocate to portfolio constituents based on risk, rather than optimizing based on risk-adjusted return. It’s a step in the right direction and does contain some elements of what Brandywine incorporated into our portfolio allocation model more than 20 years ago. But (spoiler alert) there is a fatal flaw to that approach as well, which we will discuss in a future report.

Share this post:
  • Facebook
  • Twitter
  • email
Permalink

Gambling vs. Investing

Originally published in the Brandywine Asset Management Monthly Report.

Brandywine is well known for the diversity of trading strategies we have developed over the past 30+ years and continue to employ today in Brandywine’s Symphony program. It is this strategy diversity that provides us with the opportunity to profit across a variety of market conditions and, although past performance is not predictive of future performance, to increase the probability that future returns will approximate past returns.

While Brandywine’s specific trading strategies and portfolio allocation model (which determines the allocation to be made to each trading strategy and market in the portfolio) is somewhat complex, the underlying concept upon which we base our investment philosophy is quite simple. That is, we create a portfolio that is balanced across a wide range of trading strategies, each based on a sound, logical return driver capable of providing positive returns over time. Properly employed, this approach will create a portfolio that produces greater returns with less risk than a less-diversified portfolio.

To illustrate this let’s look at a simple example using two actual trading strategies.

The first strategy is a “tail-risk” strategy designed to perform especially well during periods of financial and commodity market disruption. It has produced the following risk-return profile since the end of 1998 (the end of trading in Brandywine’s Benchmark program and the start of the simulations for Brandywine’s Symphony program [1]).

Annualized Return: 5.0%
Annualized Volatility: 23.3%
Maximum Drawdown: -44.2%
Return-to-Vol Percentage: 21%

The second strategy, in contrast to the first strategy, benefits from favorable financial market conditions.

Annualized Return: 3.7%
Annualized Volatility: 15.7%
Maximum Drawdown: -51.0%
Return-to-Vol Percentage: 24%

No one in their right mind would employ either of these two strategies as a standalone strategy in their portfolio; they’re too risky. To receive single-digit returns while risking half your money is akin to gambling. But each strategy is based on a reasonably sound return driver that would permit it to be allocated a small part (perhaps a few percent) of a portfolio. And because those return drivers are truly independent of each other, allowing one strategy to profit while the other is losing, by combining the two we get the following, much more favorable, performance:

Annualized Return: 10.3%
Annualized Volatility: 22.5%
Maximum Drawdown: -27.9%
Return-to-Vol Percentage: 45%

The tremendous benefits of “true” portfolio diversification can already begin to be seen with just these two truly independent trading strategies combined into a balanced portfolio. The annualized return of the two-strategy portfolio is more than twice as good as that of the best-performing strategy and with just half its volatility. The maximum drawdown is also significantly lower than that of either of the two strategies.

Now multiply this effect by the dozens of trading strategies incorporated into Brandywine’s Symphony program and you can understand how we achieve the ACTUAL performance results shown in these reports – where the risk-adjusted return is five times better than the average of the two strategies.

We understand that not everyone can replicate what Brandywine has built over its 30-year history. But what we can’t understand is why people would choose to gamble with their money. We say that because the second strategy shown in the above example is actually the S&P 500 total return index. Yes, the strategy that no one in their right mind would employ as a standalone strategy is the dominant strategy employed by most people in their portfolios!

Portfolio diversification is often preached but virtually never employed. Concentrating a portfolio in stocks (as well as stocks and bonds, but that’s the subject of another article) is not investing, it’s gambling. In addition to the tremendous benefits of true portfolio diversification, what this simple example shows is that the vast majority of people have been taught to gamble with their money. Instead of investing – by truly diversifying their portfolios to earn better returns with far less risk than they are taking – they choose to let substantial portions of their portfolios ride on one highly risky bet. Even if you think stocks are a good buy, why wouldn’t you find other opportunities to diversify your portfolio and reduce risk? As Brandywine has discovered, there are dozens of equally or even more compelling trading strategies that can be employed in your portfolio.

Don’t gamble – invest.

(1) Since the performance of the first strategy shown in these examples is based on back-tested (hypothetical) performance, the following disclaimer is required:

HYPOTHETICAL PERFORMANCE RESULTS HAVE MANY INHERENT LIMITATIONS, SOME OF WHICH ARE DESCRIBED BELOW. NO REPRESENTATION IS BEING MADE THAT ANY ACCOUNT WILL OR IS LIKELY TO ACHIEVE PROFITS OR LOSSES SIMILAR TO THOSE SHOWN. IN FACT, THERE ARE FREQUENTLY SHARP DIFFERENCES BETWEEN HYPOTHETICAL PERFORMANCE RESULTS AND THE ACTUAL RESULTS ACHIEVED BY ANY PARTICULAR TRADING PROGRAM.

ONE OF THE LIMITATIONS OF HYPOTHETICAL PERFORMANCE RESULTS IS THAT THEY ARE GENERALLY PREPARED WITH THE BENEFIT OF HINDSIGHT. IN ADDITION, HYPOTHETICAL TRADING DOES NOT INVOLVE FINANCIAL RISK, AND NO HYPOTHETICAL TRADING RECORD CAN COMPLETELY ACCOUNT FOR THE IMPACT OF FINANCIAL RISK IN ACTUAL TRADING. FOR EXAMPLE, THE ABILITY TO WITHSTAND LOSSES OR TO ADHERE TO A PARTICULAR TRADING PROGRAM IN SPITE OF TRADING LOSSES ARE MATERIAL POINTS WHICH CAN ALSO ADVERSELY AFFECT ACTUAL TRADING RESULTS. THERE ARE NUMEROUS OTHER FACTORS RELATED TO THE MARKETS IN GENERAL OR TO THE IMPLEMENTATION OF ANY SPECIFIC TRADING PROGRAM WHICH CANNOT BE FULLY ACCOUNTED FOR IN THE PREPARATION OF HYPOTHETICAL PERFORMANCE RESULTS AND ALL OF WHICH CAN ADVERSELY AFFECT ACTUAL TRADING RESULTS.

Share this post:
  • Facebook
  • Twitter
  • email
Permalink

Gambling on Stocks vs. Investing with “True” Portfolio Diversification

Originally published in the Brandywine Asset Management Monthly Report.

The vast majority of people do not maintain diversified investment portfolios. This is not necessarily their fault. They have been taught, through the popular press and by financial “professionals,” to gamble with their money. This is evidenced by the fact that when stocks and bonds rise in value, most people’s portfolios also rise in value. This shows, all by itself, that their portfolios are undiversified – a single “return driver” dominates their portfolios’ performances (as discussed in last month’s report here). As Mike Dever states in the chapter on gambling, investing and trading in his best seller, “If you are acutely aware of every fluctuation in the U.S. stock market, then you certainly have too much riding on the outcome. You are gambling.” Many financial advisors try to overcome this unfortunate situation by preaching to their clients to disregard such fluctuations and “invest for the long run.” But this doesn’t reduce the risk, it merely ignores it! If investing were a fantasy, this might make sense. (“Pay no attention to that man behind the curtain”). But it is very real, and risk must be dealt with head on.

There are two primary reasons people continue to be taught to gamble with their money. The first is based on an erroneous definition of risk. Often without even being aware of it, most people equate different with risky. Since ‘everyone’ preaches and holds portfolios dominated by stocks and bonds, it is considered risky to do something different. If you are an institutional investor whose performance is benchmarked to the S&P 500, there is career risk in deviating substantially from that index. Also, because individuals are often so fixated on the stock market, many financial advisors risk (there’s that word again) being fired by their clients if their portfolios underperform the major stock indexes. Rather than educate those clients on the benefits of true portfolio diversification versus gambling their money, they take the easier path of risking their clients’ portfolios rather than their own financial security. But for the vast majority of individuals, career risk is the wrong definition of risk. Their risk is defined by their probability of falling short of their required financial goals, such as funding a college account for their children or creating a nest-egg for retirement. Employing true portfolio diversification lowers that risk.

The second reason people continue to be taught to gamble is ignorance. Many financial professionals are not aware of the options available to diversify their clients’ portfolios. Virtually all the major financial publications, Internet web sites, TV broadcasts or certification programs define investing as buying stocks and bonds. There is an occasional mention of “alternatives” but the name itself suggests these are ‘optional’ investment opportunities—certainly not primary.

But there is one primary way to reduce portfolio risk, which is to employ “true” portfolio diversification. Brandywine does this by diversifying across dozens of return drivers and more than 100 global financial and commodity markets. The results are significant and can be seen in the stability of returns over time. Let’s take a look.

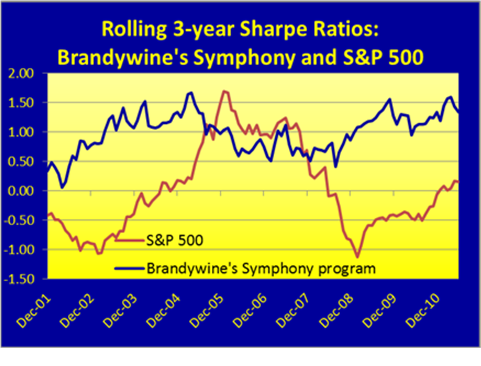
As Mike Dever points out in myth #9 of his book, “Risk Can be Measured Statistically,” volatility is a very poor measure of risk and in itself can be very volatile. This is a drawback of the Sharpe ratio – a common performance measure – which equates volatility with risk. But what is interesting is that by measuring, over longer time periods, the volatility of the Sharpe ratio, you can start to see the true risk underlying a portfolio. That is because portfolios dependent on just a few return drivers will eventually suffer significant losses when those return drivers fail to perform. This is exactly what is apparent in the chart below, which tracks the rolling 3-year Sharpe ratio for the S&P 500 and the tested performance(1) of Brandywine’s Symphony program from 2002 through June 2011. As can be seen in the chart, the Sharpe ratio for the S&P 500 varied considerably over the period while that for Brandywine’s Symphony program remained relatively stable.

This performance stability continued after the start of actual trading in Brandywine’s Symphony program in July 2011. Since that time the Sharpe ratio for Brandywine’s Symphony program, currently at 1.15, has hovered near its long-term average. On the other hand, despite the historic rally in the S&P 500 over the past few years, and the fact that its current Sharpe ratio (at 0.89) is well above its longer-term average, that value is still quite a bit below that of Brandywine’s Symphony program. This is not unexpected and provides further evidence of the global diversification value provided by an investment with Brandywine. The result is true portfolio diversification, which provides greater returns with less risk than the S&P 500.

(1) HYPOTHETICAL PERFORMANCE RESULTS HAVE MANY INHERENT LIMITATIONS, SOME OF WHICH ARE DESCRIBED BELOW. NO REPRESENTATION IS BEING MADE THAT ANY ACCOUNT WILL OR IS LIKELY TO ACHIEVE PROFITS OR LOSSES SIMILAR TO THOSE SHOWN. IN FACT, THERE ARE FREQUENTLY SHARP DIFFERENCES BETWEEN HYPOTHETICAL PERFORMANCE RESULTS AND THE ACTUAL RESULTS ACHIEVED BY ANY PARTICULAR TRADING PROGRAM.

ONE OF THE LIMITATIONS OF HYPOTHETICAL PERFORMANCE RESULTS IS THAT THEY ARE GENERALLY PREPARED WITH THE BENEFIT OF HINDSIGHT. IN ADDITION, HYPOTHETICAL TRADING DOES NOT INVOLVE FINANCIAL RISK, AND NO HYPOTHETICAL TRADING RECORD CAN COMPLETELY ACCOUNT FOR THE IMPACT OF FINANCIAL RISK IN ACTUAL TRADING. FOR EXAMPLE, THE ABILITY TO WITHSTAND LOSSES OR TO ADHERE TO A PARTICULAR TRADING PROGRAM IN SPITE OF TRADING LOSSES ARE MATERIAL POINTS WHICH CAN ALSO ADVERSELY AFFECT ACTUAL TRADING RESULTS. THERE ARE NUMEROUS OTHER FACTORS RELATED TO THE MARKETS IN GENERAL OR TO THE IMPLEMENTATION OF ANY SPECIFIC TRADING PROGRAM WHICH CANNOT BE FULLY ACCOUNTED FOR IN THE PREPARATION OF HYPOTHETICAL PERFORMANCE RESULTS AND ALL OF WHICH CAN ADVERSELY AFFECT ACTUAL TRADING RESULTS.

Share this post:
  • Facebook
  • Twitter
  • email
Permalink

Brandywine vs. S&P 500

Originally published in the Brandywine Asset Management Monthly Report.

You see that in these reports we compare our performance to both the BTOP50 CTA index and the S&P 500 Total Return index (which includes dividends). While it may make some sense for us to compare ourselves to other CTAs (after all, we are a CTA), we provide the comparison to the S&P 500 TR index not because there’s any relevance to the comparison, but because it is expected of us (investors seem to compare every investment to the S&P 500). In reality, however, it’s really neither sensible nor fair for us to compare our performance to the S&P 500.

It’s not sensible because the S&P 500, despite the “500” in its name, is a narrowly focused index, whose returns are powered by a limited number of “return drivers.” Mike Dever explains this (and discusses return drivers) at length throughout his best-seller, Jackass Investing: Don’t do it. Profit from it. In particular, in the opening chapter of his book, he shows how the S&P 500 index price is dominated by two primary return drivers. In the short-term, defined as less than 20 years (which for most people would be considered long-term), it is driven by changes in people’s enthusiasm for owning stocks. Longer-term, growth in corporate earnings is the dominant return driver. In stark contrast, Brandywine’s performance is driven by dozens of return drivers acting across more than 100 global financial and commodity markets.

It is this stark difference in the diversification between the S&P 500 TR index and Brandywine’s Symphony program that also makes a comparison of the two unfair. Over time, the S&P 500 TR index will be unable to compete on a risk-adjusted basis with the returns earned by Brandywine. This is already becoming apparent. While past performance is not necessarily indicative of future performance, since the inception of Brandywine’s Symphony program in July 2011, both the program and the aggressively-traded Brandywine Symphony Preferred Fund have produced risk-adjusted returns that exceed those of the S&P 500. This is despite the fact that Brandywine has slightly underperformed expectations and the S&P 500 has produced strong returns (relative to its historical returns) over that period.

The basis for making the statement that the S&P 500 TR index will underperform Brandywine on a risk-adjusted basis is one of simple math. Brandywine’s Symphony program incorporates dozens of trading strategies that are each based on a sound, logical return driver capable of producing positive returns over time. While any single one of them may approximate the risk-return profile of the U.S. stock market (such as a 10% expected return with the probability of an occasional 50% drawdown), in combination they produce those returns with much reduced risk. As summarized in the final chapter of Mr. Dever’s book, this is due to the fact that the returns earned by any single trading strategy in Brandywine Symphony’s portfolio are unrelated to the returns earned by the other trading strategies. When one is losing, there is the potential that another is profiting.

This is the basic concept behind portfolio diversification and Modern Portfolio Theory. Unfortunately, the way MPT is taught and practiced by most people is not true investing; it’s gambling. That is because their portfolios may contain as much as 20%, 30% or even 60% long stock exposure. By creating portfolios that are dominated by long stock exposure, they are gambling their money on a single return driver (people’s enthusiasm for stocks). Brandywine’s Symphony program is also exposed to global stock markets, but as we practice ‘true’ portfolio diversification, this sector represents just 17% of the portfolio, and that portion is dynamically allocated both long and short among the stock indexes of dozens of countries. The remaining 83% of Brandywine’s portfolio is allocated to trading strategies taking positions in the currency, interest rate, metals, energy and agricultural commodity markets.

If, over time, many of these trading strategies have a positive return, then over time Brandywine’s Symphony program will produce those returns, but with substantially reduced risk. In fact, because Brandywine’s drawdowns are smaller than those of a less diversified portfolio (such as one dominated by long stock exposure), the return can actually be greater than the average return of each strategy, as the portfolio spends more time producing new profits, rather than recovering from past losses. This is how we are able to produce such high absolute returns (such as the 20%+ annualized returns of the Brandywine Symphony Preferred Fund) and risk-adjusted returns.

We find that many people allocate their money based on fear. Interestingly, the fear of missing out is often greater than the fear of losing. Because of the overwhelming focus on the “stock market,” many people fear missing out on its potential returns, when in fact they could actually exceed those returns, with less risk, by investing in a truly diversified portfolio.

Share this post:
  • Facebook
  • Twitter
  • email
Permalink

The Abuse of Correlation

Originally published in the Brandywine Asset Management Monthly Report.

Throughout the years, we have observed an abuse of the correlation statistic in selecting managers. People seem to forget that their goal is to find managers who, when combined with each other, will increase overall portfolio returns and decrease risk (especially event risk). They are looking at correlation in order to help them find such managers, since non-correlation may be an indication of this diversification value. But instead of focusing on the goal, people have become increasingly focused on the correlation metric, which often results in them missing their goal, which is (we’re repeating ourselves here) to find managers who will increase portfolio returns and decrease risk.

Brandywine’s Symphony program has a negative –0.06 correlation to the S&P 500, a 0.07 (non) correlation to the AlphaMetrix managed futures index and a low 0.34 correlation to the Barclay CTA index. Despite that, we occasionally hear analysts report to us that they find Brandywine Symphony’s performance to be “more correlated to trend followers” than they would expect, based on the fact that our portfolio is dominated by fundamentally-based, non-trend-following trading strategies (100% systematically applied). And that may be true. We don’t specifically structure our portfolio, as do some CTAs, to be un-or-negatively correlated. We just want to make money as consistently as possible with (this is the most important condition) a high probability that future performance will match past performance. Although the majority of our portfolio is fundamentally-based, we do have a 20% exposure to trend following. When trends occur, we want to be on the right side of them, and that does boost our correlation to trend followers in those trending periods (a GOOD thing!). But what really matters is not our correlation, but our value in achieving THE GOAL, which is to “increase portfolio returns and decrease risk.” Towards that goal we succeed completely.

One indication of this is that during Brandywine’s test period 1999 through June 2011, the BTOP 50 managed futures index suffered 18 drawdowns averaging -4.74%. During those periods Brandywine’s Symphony program GAINED +0.74% and our correlation with the index during those periods was a NEGATIVE 0.06. Furthermore, in keeping with the condition that past performance must be as predictive as possible of future performance, this characteristic holds up in actual trading. Since the launch of Brandywine’s Symphony program in July 2011, the BTOP 50 suffered a -5.21% drawdown. During that same drawdown period Brandywine’s Symphony program gained +5.74%.

So why is our correlation positive overall and should it be viewed as problematic?  Well, let’s ask a simple question. . . When the BTOP 50 is up, what would you prefer if you were invested with Brandywine’s Symphony?  Would you prefer we lose money to keep our correlation negative or would you prefer we make money, at the risk that someone misusing the correlation statistic might simply view an unparsed correlation number and think that embedded in the statistic was useful information?  The only reason (the “problem” if you will) that inflates our correlation statistic, is that we make money when the trend followers make money, even though most of what we do is driven by non-trend following trading strategies.

We would contend that as long as we make money when others are losing money (which we do) and are thus negatively correlated when trend-followers are losing money (which we are) then one should treat with great caution any statistic that would lead one to allocate less to Brandywine simply because we make money when others are also making money!

One way to see our value is to simply add Brandywine’s Symphony program to a portfolio and see the effect. We encourage you to present us with your portfolio. We will run a simple analysis that shows how that portfolio would perform with various allocations made to Brandywine’s Symphony. Because of the unique return drivers incorporated in Brandywine’s Symphony program, we are confident that the inclusion of Brandywine will both increase returns and decrease risk in your portfolio.

We look forward to talking with you soon.

Share this post:
  • Facebook
  • Twitter
  • email
Permalink

Mike Dever Interview with Asset International

Please click the image above for Mike Dever’s interview on January 16, 2013 with Paula Vasan, Managing Editor of “aiCIO” (Asset International Chief Investment Officer). During the interview, Mike and Paula discuss the following investment “myths”:

  • The Largest Investors Hold All the Cards
  • Trading is Gambling – Investing is Safer
  • Too Much Diversification Lowers Returns

Here’s what you’ll learn:

  • How to identify if you are a gambler.
  • What is the largest impediment to strong positive returns over time.
  • Why Mike decided to title his book “Jackass Investing”.
Share this post:
  • Facebook
  • Twitter
  • email
Permalink

The Year in Review

Originally published in the Brandywine Asset Management Monthly Report.

2012 was the second consecutive losing year for the BTOP 50 managed futures index. This is the first back-to-back annual loss for the index since its inception 26 years ago. Systematic and diversified CTAs performed even worse than the broader index.

In contrast, Brandywine posted its second consecutive profitable year since the launch of Brandywine’s Symphony program in July 2011. So why has Brandywine – a systematic, diversified CTA – performed so well when our peers have not? The answer is rooted in our extensive history and unique investment philosophy.

Brandywine’s Innovations

Brandywine’s difference is not just one of performance, but one of design. Brandywine’s Symphony program was based on, and is the culmination of, the 30+ years of research and trading conducted by Brandywine since our founding in 1982. During that time Brandywine originated several approaches to managed futures trading and risk management.

In 1991 – at a time when traders were either “fundamental discretionary” or “systematic trend following” – we introduced fundamentally-based systematic trading in our Brandywine Benchmark program. At the same time, we innovated what today has become known as “risk-parity” portfolio modeling. This innovation, which bases portfolio allocation on balancing risk across a portfolio, was documented in a paper that was distributed by Brandywine to investors in the early 1990s. While the rest of the investment world has recently caught on to risk parity, they are still bound by the archaic concept of asset classes.

Brandywine recognized the limitations imposed by the use of asset classes, and so along with its development of risk parity modeling, Brandywine also introduced the concept of “return drivers.” This innovation (the use of return drivers) is discussed throughout Mike Dever’s book, Jackass Investing: Don’t do it. Profit from it., which was published in 2011 and remains an Amazon best-seller.

Brandywine’s Performance

The combination of multiple return driver based trading strategies that incorporate fundamentals in addition to technical factors, risk parity portfolio modeling, and diversification across more than 100 global markets (including financials and commodities), enabled Brandywine to consistently outperform its peers during the 1990s. Brandywine’s Symphony program is continuing this legacy of performance. This is evidenced not only by our positive performance, but by the fact that our current actual performance closely matches our expectations based on our actual past performance and updated testing. If you would like to discuss Brandywine’s investment philosophy, research innovations and performance in more detail, please contact Mike Dever or Rob Proctor, and we will schedule a call to discuss and answer your questions.

Best wishes for a successful New Year.

Share this post:
  • Facebook
  • Twitter
  • email
Permalink