Originally published in the Brandywine Asset Management Monthly Report.
The Virtues of Return Driver based Investing
In 1934, Benjamin Graham and David Dodd introduced the world to value investing when they published their seminal book Security Analysis. In 1948, Richard Donchian introduced the world to momentum trading after he launched the first public futures fund and applied “trend following” (momentum trading) to a diversified portfolio of futures markets.
Both value and momentum are valid “Return Drivers.” Warren Buffett made billions by following value principals to select stocks. John W. Henry earned billions (which he parlayed into a sports empire that includes the Boston Red Sox) by employing momentum strategies to trade futures contracts on global financial and commodity markets. Significant profits were also produced by other investors who employed these Return Drivers in the decades following their introduction.
For the first half century after they were “exposed,” the excess return which traders earned by employing strategies based on these Return Drivers was considered “alpha.” This was in contrast to the returns that could be obtained simply by buying-and-holding the “market,” which has been called “beta.”
Slowly, however, others began to take notice. In1992, Eugene Fama and Kenneth French published “The Cross-Section of Expected Stock Returns” in The Journal of Finance. In the paper they bestowed an academic imprimatur on value investing. In later papers they and others presented research that revealed the effectiveness of momentum investing. Over time, the profit earned from employing strategies based on these Return Drivers was no longer considered alpha. But they didn’t yet fit into the classic definition of “beta.” A new term was required. Enter “Smart Beta” or “Strategic Beta.”
This leads to the question, “What is Beta, Smart Beta and Alpha?”
The answer starts with understanding Return Drivers.
What is a Return Driver?
A Return Driver is the primary underlying condition that drives the price of a market. When it is defined in this fashion, we realize that buying-and-holding stocks isn’t beta. It is simply another Return Driver based investment strategy – the Return Driver being the fact that over the longer-term (periods of 20 years or more) an increase in corporate earnings leads to an increase in stock prices. If you believe there should be an increase in earnings, buy stocks. Value investing is simply the acknowledgment that over the long term, competition results in a leveling of profit margins among similar companies, so all else being equal, buying the “cheaper” stock today will produce greater returns than buying the “expensive” stock.
Once Fama and French uncovered value (and also the small cap effect) as being valid Return Drivers (they and other academics refer to them as “Risk Factors” under the misguided belief that returns are earned in exchange for assuming risk, which is seldom the case), the floodgates began to open for equity investors.
Over the past decade or so, academics have “discovered” numerous Return Drivers, including those based on dividends, volatility, illiquidity, and cash flow; and fund marketers have launched hundreds of smart beta mutual funds and ETFs designed to capture profits (for themselves at least!) by exploiting these Return Drivers.
But there is nothing special about smart beta. And once we understand that every valid investment strategy (such as buying-and-holding stocks or value investing) is based on a relevant Return Driver, we realize that beta, smart beta and alpha are merely terms used to differentiate the level of public acceptance of each Return Driver. In short:
Beta describes strategies (such as buy-and-hold) that are based on Return Drivers that are widely exposed and accepted as being valid in the public domain.Smart Beta refers to Return Drivers that have been exposed but are not yet as widely employed or accepted in the public domain.
Alpha is the term used to describe Return Drivers that are not yet widely disseminated or accepted in the public domain.
It’s as simple as that.
How this Relates to Brandywine
Brandywine employs a diversified Return Driver based approach to invest across more than 100 global financial and commodity markets. The vast majority of our strategies are based on Return Drivers that are not widely disseminated or accepted in the public domain and therefore are considered “alpha.” That said, we are agnostic as to how others may classify our strategies, whether alpha, beta or other. Our only interest is to achieve the most consistent and predictable returns possible over the long-term. We do this by creating a portfolio balanced across Return Drivers and markets. Interestingly, this single-minded focus to employ the best and most diverse Return Drivers results in performance that is also completely uncorrelated with that of all major investment indexes and other investment managers. This is illustrated in the chart below:
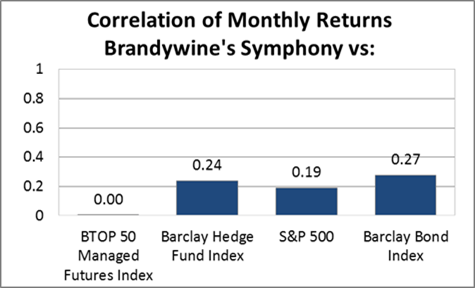
Despite our unique approach and resultant non-correlation however, Brandywine’s Symphony Program is often confused with trend following CTAs. This is because, similar to them, Brandywine is registered with the Commodity Futures Trading Commission and is a CTA member of the National Futures Association. And since the majority of money being managed by CTAs is invested pursuant to trend following strategies, Brandywine is often, incorrectly, considered to be a trend follower.
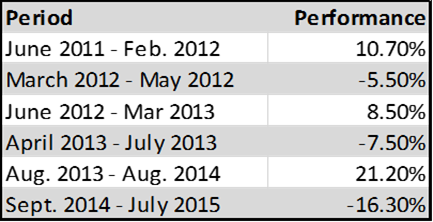
But as is made clear by the preceding correlation chart, our registration does not define our method. With a zero correlation, Brandywine is clearly doing something different. But does different mean better? We think so. Despite currently being in the midst of our largest drawdown to date (which troughed at -13.94%), and the CTA indexes hitting new highs (on the back of strong trends in currency, interest rate and energy markets), Brandywine has still outperformed the CTA indexes since the inception of Brandywine’s Symphony Program in 2011. But not only does our Return Driver based approach make us different, it also underlies the reasons why Brandywine is well-positioned to serve as the core investment in any investment portfolio:
Brandywine has the necessary traits that are required to be a “core” investment:
Brandywine’s Symphony Program is highly diversified. With a single investment Brandywine provides investors with coverage across more than 100 global financial and commodity markets. Equity portfolios lack the diversity of Return Drivers, and specialized CTAs lack the strategy or market diversification required to serve as a true “core” holding.Brandywine employs a systematic process that solves for performance predictability. Other investment programs that rely on the daily decisions of a key person or team are subject to model variability, as day-to-day trading activity is subject to the feel of the portfolio manager(s).
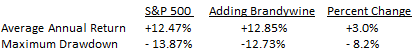
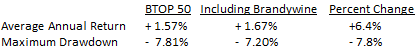
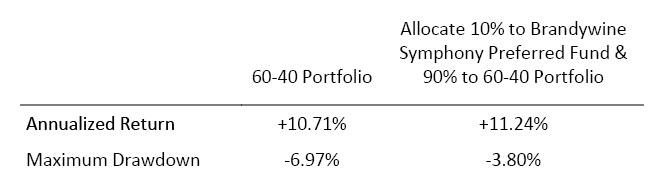
Brandywine’s performance is uncorrelated to every other investment. With Brandywine at the core, virtually any other investment can be added to a portfolio and it will provide diversification value. This is not the case if a long-only equity manager or other diversified CTA (such as a trend follower) is placed in the core position.
Brandywine’s Symphony Program provides liquidity and transparency.
In Summary…
Beta is a term that was developed to describe stock market returns. Rather than uncovering the true underlying Return Drivers, academic explanations such as the equity risk premium were developed to explain rising stock prices. While this puts a name on observed market behavior, it does nothing to enable an investor to create trading strategies based on exploitable Return Drivers.
Return Driver based investing requires explanations. This not only leads to a truer understanding of the source of returns, but also opens up the opportunity to uncover additional Return Drivers that can serve as the basis for multiple investment strategies, each relevant to a particular market. Value, momentum, illiquidity and the small cap effect are just some of the many, many Return Drivers available. But once it is understood that they are Return Drivers, and not magical alpha, or smart beta, the framework exists to develop additional investment strategies, based on other unique Return Drivers, and create truly diversified portfolios capable of producing positive returns across a wide range of conditions.