Drawdowns – Omen or Opportunity?

Originally published in the Brandywine Asset Management Monthly Report.

Over the past three months, Brandywine’s Symphony Program suffered its largest drawdown, -11.36%, since the start of trading in July 2011. Drawdowns are a natural part of trading and Brandywine’s Symphony Program is no exception. But for most investors, they provoke discomfort and prompt a series of questions. We know this because over our decades of trading (and yes, prior drawdowns), we have fielded a number of questions, as well as asked a number of them ourselves. In this report we’ll present some of those questions and discuss the current drawdown, as well as future expectations, in the form of a Q&A.

What caused the loss over the past three months?
Brandywine’s Symphony Program incorporates a variety of trading strategies, each based on a sound, logical return driver designed to produce a positive return over time. And since inception these trading strategies, in the aggregate, have been solidly profitable. But during the current drawdown period, September through November, a disproportionate number of those strategies incurred losses while very few produced sizable gains. Specifically, a majority of the losses were caused by fundamentally-based strategies and those we describe as directional arbitrage or that employ intermarket relationships. In our due diligence questionnaire we prepared three years ago, we identified rapid downtrends in markets as being the worst environment for those strategies. With crude oil dropping more than 40% in an uninterrupted downtrend (and 10% alone on the last day of November), and other commodities such as silver, cotton and currencies [such as the Australian dollar] mired in 10% to 30% drawdowns, those strategies hit their “perfect storm” over the past few months.

Other futures traders had some of their best performance in years, why didn’t Brandywine?
Since the inception of Brandywine’s Symphony Program in 2011 we have consistently stressed that Brandywine’s unique approach to research and trading would produce returns that were non-correlated to all other investment indexes and investment managers, including CTAs. This non-correlation was exhibited in full force in November and over the past three months. After lagging Brandywine’s performance for the three years leading up to the start of our drawdown in September, the BTOP 50 and Newedge CTA indexes each rallied approximately 8%. Despite the strong performance differential, Brandywine has still outperformed those indexes since inception. Even better, because of Brandywine’s non-correlation to those indexes, adding Brandywine to a portfolio that contains CTAs results in both increased returns and reduced risk (yes, even measuring Brandywine’s performance from the low point of the current drawdown).

What are your expectations going forward?
When Brandywine suffered a drawdown in mid-2013, we stressed in our monthly report our belief that it was an excellent time to consider investing or adding to an investment with Brandywine. That belief turned out to be prescient. In the 12 months following the Brandywine Symphony Program’s drawdown in 2013, the Program produced a solid positive return of +15.83% and the aggressively-trade Brandywine Symphony Preferred gained a substantial +65.33%.

While prudence and regulations require us to state that PAST PERFORMANCE IS NOT INDICATIVE OF FUTURE PERFORMANCE, history leads us to expect similar strong returns going forward today. This expectation is based on our historical testing and actual trading performance. In fact, in the 12 instances (both tested and actual) where Brandywine’s Symphony Program fell by more than 8% (on a gross, end-of-day basis), the following 12 month return has averaged more than 18%. Of course, Brandywine Symphony Preferred, trading at three times standard risk, would produce substantially greater returns; although as we must also state THERE IS THE RISK OF LOSS AS WELL AS THE OPPORTUNITY FOR GAIN WHEN INVESTING WITH BRANDYWINE.

Share this post:
  • Facebook
  • Twitter
  • email
Permalink

Predicting Performance

Originally published in the Brandywine Asset Management Monthly Report.

If there was ever a heading that would attract the attention of regulators, this could be it. That is because there is no accurate way to truly predict performance. In fact, every document we send out clearly states in bold type at the bottom of every page, that “PAST PERFORMANCE IS NOT NECESSARILY INDICATIVE OF FUTURE RESULTS. THERE IS THE RISK OF LOSS AS WELL AS THE OPPORTUNITY FOR GAIN WHEN INVESTING WITH BRANDYWINE.”

The fact is that there is only the ability to estimate probabilities of performance, and even those estimates have probabilities associated with them. That said, we were reasonably confident in making this statement to a potential investor in Brandywine Symphony Preferred Fund earlier this year, “You WILL incur a 30%+ drawdown at some point if you invest in Brandywine Symphony Preferred Fund.”

That was because every measure of Brandywine’s past performance , both actual and tested, pointed to Brandywine’s Symphony Program incurring a 10% drawdown. And since the Brandywine Symphony Preferred Fund trades at three times the risk level of Brandywine’s Symphony, a 30% drawdown was, and is, expected.

Although we haven’t quite reached that level, at -27.50%, the drawdown of September—October brings us close to that level. It may seem to be a strange word to use, but we were confident we would incur that loss, precisely because of the confidence we place in our research process.

We included a chart in last month’s report that showed the 16 largest drawdowns over the past (almost) 16 years (which includes 12.5 years of tested performance and close to 3.5 years of actual performance). That chart, which is updated and reproduced here, shows that Brandywine’s Symphony Program, measured on a gross return, end-of-day basis, should average a drawdown of between 7.25% and 11.64% once each year.

Image - 201410

This shows the current drawdown as being right in line with expectations, as we should incur a drawdown of this size approximately once every three years (and we just completed our 40th month of actual trading). So this raises the question – is this investible information? Does the fact that Brandywine’s Symphony Program has reached an expected drawdown level indicate that it is time to invest? Perhaps. When we incurred our drawdown last year (which, as illustrated by the other light colored bar on the chart, reached a peak intra-month level based on gross performance of -8.38% at the end of July 2013), we stated that “now may be an excellent time to invest with Brandywine.” Since that time—including (and despite) the current drawdown—an investment in Brandywine’s Symphony has returned +9.67% (and an investment in Brandywine Symphony Preferred Fund has gained more than +36%).

We feel we are in a similar position today. And to paraphrase what we said then, we realize history is not a perfect guide, and past performance is not indicative of future performance, but if you are prepared to take an analytical—rather than emotional—approach to investing, now may be a good time to consider Brandywine.

Share this post:
  • Facebook
  • Twitter
  • email
Permalink

Benchmark-itis

Originally published in the Brandywine Asset Management Monthly Report.

The investment world lives by benchmarks. Every institutional investor benchmarks the performance of the individual components of their portfolio to various indexes. Individual investors do the same. That’s why the financial news constantly refreshes the current performance of the Dow Industrials or the S&P 500. This is partly due to regulatory mandate. In 1998 the SEC began to require mutual funds to show their performance relative to a benchmark. They felt this would better enable investors to determine whether a fund was performing well because of investment decisions made by its manager or simply because of factors outside their control. But mostly, benchmarking is seen as a necessary exercise to determine the effectiveness of a fund’s management team.

As a result of this “benchmark-itis,” we often get asked by investors, “against which benchmark should we compare your performance?” Suggestions include the S&P 500 (because everyone watches that), hedge fund indexes (because our return driver based approach is “non-traditional”), or maybe the CTA indexes (since we execute our strategies in the futures markets).

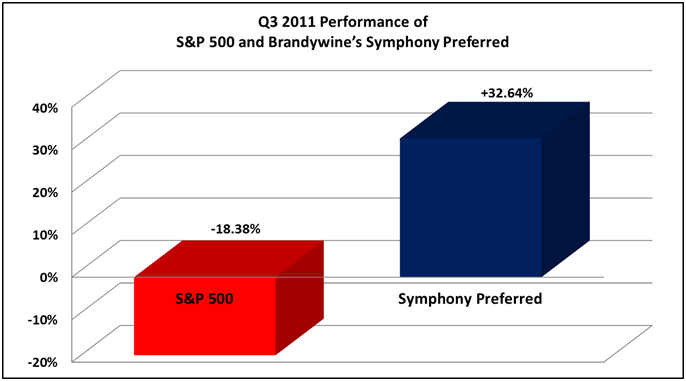
But none of these are a proper benchmark for Brandywine’s Symphony Program. That’s because Brandywine doesn’t employ trading strategies based on common, “public domain” return drivers. As a result, our returns won’t necessarily have any relationship to any index return. For example, some of Brandywine Symphony’s best-performing periods have occurred when stocks dropped significantly (such as during Q3 2011). And Brandywine shows no correlation of returns to any of the few dozen hedge fund indexes. With regards to CTA indexes, well, this year provides a great example of how uncorrelated Brandywine is. While most of the CTA indexes exhibited losses from January through July, Brandywine produced solid profits. And although Brandywine gained strongly along with the CTA indexes in August, our sharp loss in September was in stark contrast to gains for the CTA indexes. Whether we over- or under-perform relative to any of the standard benchmarks over any period of time is essentially random and irrelevant.

Brandywine’s Benchmark
So what is the best index with which to compare Brandywine Symphony’s performance? It’s our own past performance.

The reason is because Brandywine’s Symphony Program follows a return driver based approach that incorporates dozens of independent trading strategies, each based on a sound logical, non-public domain return driver, to trade across more than 100 global financial and commodity markets. Our goal is to achieve the highest possible return for any given level of risk with a reasonable probability that our future performance will match our past performance. We do not employ a single style that can be reflected in any single index.

Which leads to the question, “how is Brandywine’s Symphony Program performing relative to its benchmark (its own past performance)?” Since September posted the worst monthly loss since Brandywine’s Symphony Program began actual trading in July 2011, we’ll focus on the downside behavior.

Brandywine’s walk-forward back-test for our Symphony Program runs from January 1999 up to the start of our actual trading in July 2011(1). Virtually all performance tracking services publish an investment program’s maximum drawdown on a month-end basis (measuring the drop in performance across one or more months from the highest month-end peak to a subsequent month-end low). We’ll look at our drawdowns on that basis as well as gross end-of-day performance (which will almost always be larger as it captures intra-month losses and does not receive any benefit from potential incentive fee give-backs).

Brandywine Symphony’s Drawdowns in Line With Benchmark
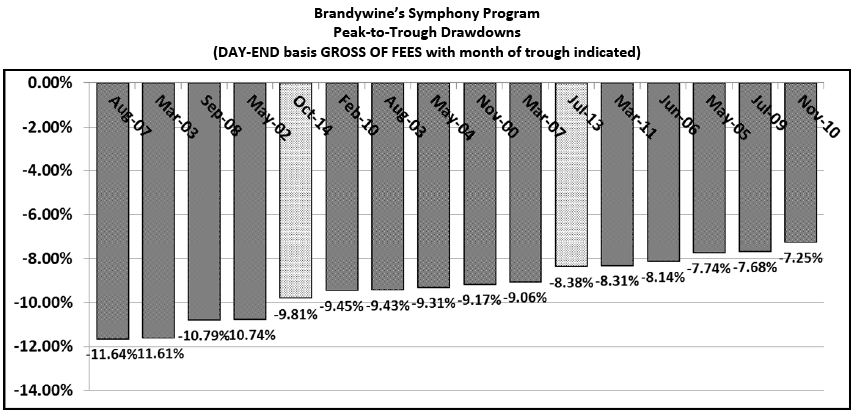
In the first chart we display the 16 largest month-end peak-to-trough drawdowns (on a net basis) over the past 16 years (this includes tested performance (dark bars) from 1999 through June 2011 and actual performance (light bars) starting in July 2011). We would expect to incur a drawdown within the range of this chart on average once per year, and that is exactly what has happened. Since the start of actual trading in July 2011 we have had three drawdowns make it onto the chart. The most recent drawdown, which has been almost perfectly bracketed by the beginning and end of September (making the end-of-day performance match the month-end performance quite closely), is right in the middle of the range at -6.46% (this also indicates that it could extend an additional 3% and still remain within expectations).

201409 Image 1

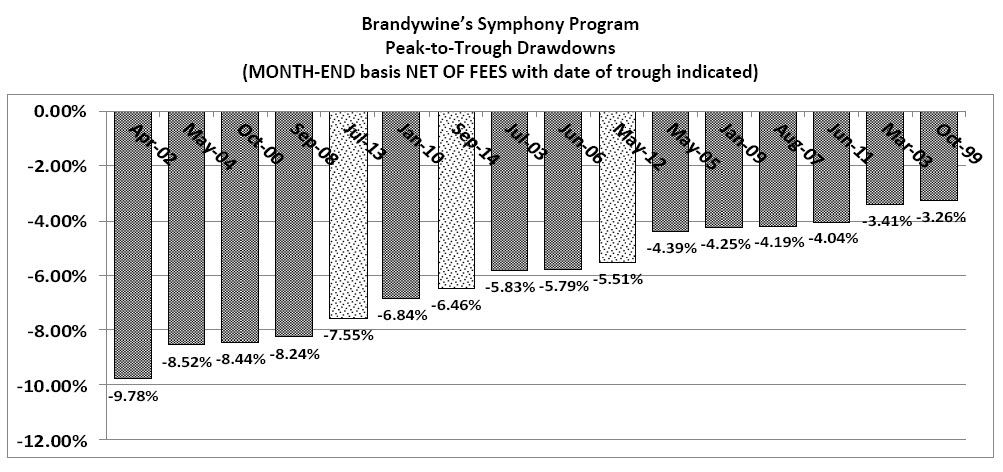
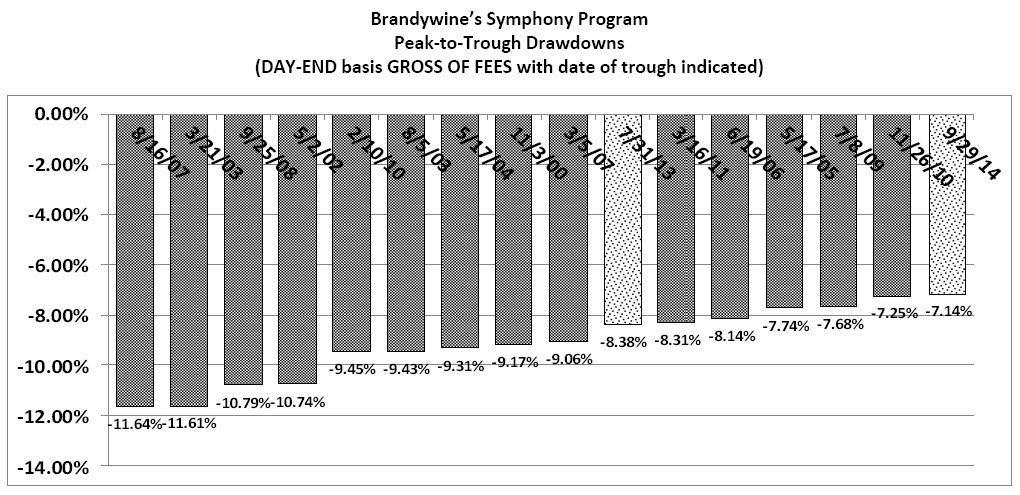
Now let’s look at the 16 largest drawdowns as measured on a gross, end-of-day basis. We would expect a drawdown to fall within this range on average once per year. As you can see in the following chart, the current drawdown, at -7.14%, just made it onto the chart. Since the start of actual trading in July 2011, two drawdowns made the “bottom 16” and neither registered among the worst. So our performance in actual trading has been slightly less “risky” than our benchmark would project.

201409 Image 2

One final way to view the current drawdown is to compare this past month’s performance to other 22-day periods (the number of trading days there were in September) in our history. In that regard, this is the 5th deepest 22-day drawdown (measuring the worst 22-day period within all past drawdowns) over the past 16 years. This indicates that a drawdown of this size should occur over a 22-day period once every 3 years. Since we just wrapped up 3 ¼ years of trading, this drawdown is right in line with expectations.

Drawdowns are just as much a part of the performance of Brandywine’s Symphony Program (as well as any investment) as are positive returns. The fact that the drawdowns we have incurred in our actual trading so closely match our Benchmark expectations is confirmation that our investment model continues to work as expected. In summary, the performance of Brandywine’s Symphony Program, as measured by the drawdowns we have incurred since the start of actual trading in July 2011, has been faithfully tracking our expectations pursuant to our benchmark, which is our past performance.

(1) Because this report includes the results of the tested performance, in addition to the actual performance, of Brandywine’s Symphony program, the following disclaimer is required:

HYPOTHETICAL PERFORMANCE RESULTS HAVE MANY INHERENT LIMITATIONS, SOME OF WHICH ARE DESCRIBED BELOW. NO REPRESENTATION IS BEING MADE THAT ANY ACCOUNT WILL OR IS LIKELY TO ACHIEVE PROFITS OR LOSSES SIMILAR TO THOSE SHOWN. IN FACT, THERE ARE FREQUENTLY SHARP DIFFERENCES BETWEEN HYPOTHETICAL PERFORMANCE RESULTS AND THE ACTUAL RESULTS ACHIEVED BY ANY PARTICULAR TRADING PROGRAM.

ONE OF THE LIMITATIONS OF HYPOTHETICAL PERFORMANCE RESULTS IS THAT THEY ARE GENERALLY PREPARED WITH THE BENEFIT OF HINDSIGHT. IN ADDITION, HYPOTHETICAL TRADING DOES NOT INVOLVE FINANCIAL RISK, AND NO HYPOTHETICAL TRADING RECORD CAN COMPLETELY ACCOUNT FOR THE IMPACT OF FINANCIAL RISK IN ACTUAL TRADING. FOR EXAMPLE, THE ABILITY TO WITHSTAND LOSSES OR TO ADHERE TO A PARTICULAR TRADING PROGRAM IN SPITE OF TRADING LOSSES ARE MATERIAL POINTS WHICH CAN ALSO ADVERSELY AFFECT ACTUAL TRADING RESULTS. THERE ARE NUMEROUS OTHER FACTORS RELATED TO THE MARKETS IN GENERAL OR TO THE IMPLEMENTATION OF ANY SPECIFIC TRADING PROGRAM WHICH CANNOT BE FULLY ACCOUNTED FOR IN THE PREPARATION OF HYPOTHETICAL PERFORMANCE RESULTS AND ALL OF WHICH CAN ADVERSELY AFFECT ACTUAL TRADING RESULTS.

Share this post:
  • Facebook
  • Twitter
  • email
Permalink

The Constraint of Asset Classes

Originally published in the Brandywine Asset Management Monthly Report.

Since the 1960s, asset classes have dominated the investment landscape. Originally “invented” out of necessity, they evolved to serve as the foundation of conventional portfolio diversification. They got their start shortly after Harry Markowitz published his seminal paper “Portfolio Selection.” This paper eventually led to the popular adoption of mean-variance modeling to create “optimally” diversified investment portfolios. But in order to determine an optimal stock portfolio, the Markowitz model required a person to calculate the covariance of every stock in a portfolio in relation to all others. Because computer technology was in its infancy and the “cost” (not just in computer resources but in actual dollars and cents as well) to do this was exorbitant, a simpler method needed to be devised. Enter Bill Sharpe, who developed a simplified system that instead compared each stock to the market as a whole. The “market as a whole” became an asset class. Initially, there were just a few asset classes, such as stocks, bonds and cash.

Over the years, investment professionals have established increasingly varied asset classes (and sub-asset class “categories”). For example, many now consider real estate and commodities to be asset classes. And emerging market stocks and high-yield bonds may still be considered to be part of the stock and bond asset classes, but they are also understood to behave differently and are therefore considered to be sub-categories of their asset classes.

All this would be just an interesting (to some) academic discussion if it weren’t for the fact that trillions of dollars in investment decisions are based on allocating capital across asset classes. This makes asset classes an important and integral part of investing. And that is a problem, because the use of asset classes imposes an unnecessary constraint on a person’s ability to create a truly diversified portfolio. But before we explain why, we’d like to introduce the concept of return drivers.

From Asset Classes to Return Drivers
One of the innovations supporting Brandywine’s investment philosophy is our use of return drivers. As Mike Dever states in his book, “a return driver is the primary underlying condition that drives the price of a market” and “every return driver has a time period (and markets) over which it is relevant.” Realizing that the best way to explain the return driver concept is by example, in the opening chapter of his book Mike displays the result of research that shows the relative influence of the two primary return drivers that power stock prices (which are people’s sentiment towards stocks and the growth of corporate earnings). You can read a complimentary copy of the book’s Introduction and first chapter here: https://www.brandywine.com/pdf/special/JackassInvesting_BookThruMyth1.pdf.

Once those return drivers have been identified, they can be exploited to serve as the basis for trading strategies. Mike demonstrates this in the book’s Action Section, where he shows how to develop a specific trading strategy that uses ETF money flows to exploit short-term sentiment in stock indexes and bond markets. This is an actual trading strategy being used by Brandywine today.

The basic nature and elegance of return drivers becomes apparent when you realize that all an asset class is, is a specifically constrained trading strategy employed against a group of related markets. For example, corporate earnings growth is the dominant return driver of U.S. equity prices over periods of 30 years or more. So the U.S. equity “asset class” is simply the application of a trading strategy (holding naive long positions), applied to U.S. equities, designed to capture that return driver.

But there are potentially dozens of sound, logical return drivers (as equally sound as earnings growth driving long term stock prices) that can be exploited to profit from trading in the U.S. equity markets. And there are potentially hundreds of additional return drivers that can be exploited to profit from trading in the hundreds of other freely-traded global financial and commodity markets. To ignore those and exploit just one creates a logical inconsistency. The stated desire of most institutional investors and their consultants (as well as most individual investors) is to create a diversified investment portfolio. But their dependence on asset classes immediately constrains their ability to do so.

One way to attempt to fix this is to expand the universe of asset classes. In the past few years, firms such as Goldman Sachs have suggested that volatility be considered an asset class. We understand their desire to do this. Volatility trading in equities is based on a sound, logical return driver that produces returns that are uncorrelated to equities. It provides tremendous portfolio diversification. But pigeonholing volatility into the asset class construct is awkward and cosmetic. It’s not a true fix.

Brandywine’s Use of Return Drivers
Return driver based investing provides that true fix. Once you recognize that every asset class is powered by return drivers, and is therefore simply a subset of a single trading strategy, it actually becomes illogical to pursue an asset class approach instead of a diversified return driver based approach to investing. That is why return drivers are one of the key concepts underpinning Brandywine’s investment philosophy and an integral contributor to our performance. In contrast, there is an inherent and sizable disadvantage to being asset class constrained.

We pointed this out in our February 2013 report, where we stated that because of the dependence of the S&P 500 on two primary return drivers and Brandywine’s broad diversification across return drivers that “over time, the S&P 500 TR index will be unable to compete on a risk-adjusted basis with the returns earned by Brandywine.” This continues to be our belief today.

Resources
The myth that portfolio diversification can be achieved by allocating money across asset classes is exposed in Chapter 17 of Mr. Dever’s book. You can read a complimentary copy of that chapter here: https://www.brandywine.com/pdf/special/JackassInvesting_Myth17.pdf.

Share this post:
  • Facebook
  • Twitter
  • email
Permalink

Gambling vs. Investing and the Stock Fixation

Originally published in the Brandywine Asset Management Monthly Report.

Gambling vs. Investing
In a conference presentation given by Mike Dever to a group of retail investors last year, 10% of the audience walked out before he even got to his first slide.

Mike started his talk by asking how many people in the audience were investors. Virtually everyone raised their hand. He then asked them if their portfolios made money when the market went up, and lost when the market went down. Again, virtually everyone in the audience raised their hand. His next statement was intended to get their attention. He told the audience that contrary to what they thought, they actually were NOT investors. They were gamblers. Following that, 10% of the audience, insulted, got up and left. His point was that if any single market dominates your performance, you’re gambling.

He followed this by explaining to the remaining people that he never told them which “market” he was referring to, yet they all assumed it was the stock market. This underscores the level of fixation people have on owning stocks. No other markets enter their thoughts, when in reality there are literally hundreds of other, equally valid markets across which they can profitably diversify their portfolios.

The Stock Fixation
In several prior reports(1), we discussed the fixation people have on stocks and how they intentionally hold over-weighted long equity positions. In fact, it is often touted that the model diversified portfolio is one that is comprised of 60% long stocks and 40% long bonds. But as Mike Dever states in “Myth #8: Trading is Gambling – Investing is Safer” of his best-seller, “A person who is 60% long stocks and 40% long bonds is taking unnecessary risk. They are gambling.” That is because they are unnecessarily dependent on just three dominant return drivers – investor sentiment and earnings growth that power stock prices(2), and interest rate levels that power bond prices. If those falter, so does their portfolio. That doesn’t even come close to defining “diversification.”

True portfolio diversification can only be achieved by diversifying across return drivers and markets. Because stock prices are powered by only two principal return drivers, a portfolio that is dominated by long stock positions will never be diversified. As a result, you will get performance that looks like this:


Graph 1

Don’t get seduced by the fact that this graph ends on a high note and many stocks are now at all-time highs. People who concentrate their money in stocks have exposed themselves to unnecessary risk. The risk is unnecessary because it is easily diversified away. While academics and conventional financial wisdom tout the benefit of diversifying across additional “asset classes” such as bonds, gold and real estate, this displays a lack of understanding of the return drivers that drive the prices of each of those markets. Owning bonds at 3% is not the same as owning bonds at 10%. Return driver based investing adjusts for that fact.

To illustrate this point, let’s add a second return driver to the portfolio, in the form of a fundamentally-based strategy trading in commodity markets. When combined with the long-only S&P 500 strategy, not only is performance improved, but risk is also dramatically reduced.


Graph 2

The smoother blue line (the two-strategy portfolio) is clearly more desirable than the erratic red line (the S&P 500 Total Return index). The concept of portfolio diversification is really as simply as what we’ve just shown. But it doesn’t stop there.

The fact is there are potentially hundreds of return drivers that can be employed to truly diversify a portfolio. This diversified return driver based approach is at the heart of Brandywine’s Symphony Program, which employs dozens of trading strategies – based on a diversity of return drivers – to trade across more than 100 global financial and commodity markets. The result is a portfolio that targets returns in excess of those that can be earned from stocks, but with substantially less risk. This is not just theoretical. You can see the actual results now.

A Comparison: Brandywine vs. Stocks
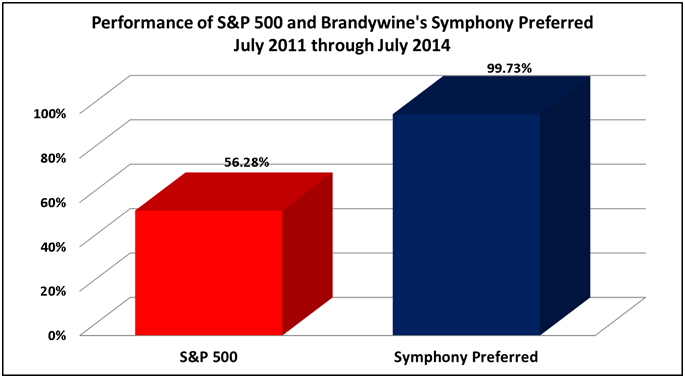
U.S. equities have had a great run over the recent past. Since the launch of Brandywine’s Symphony Preferred in July 2011, the S&P 500 has gained 56%. But as shown in the first graph in this report, this return, because it was dependent on two dominant return drivers, subjected its participants to high levels of event risk.

In contrast, Brandywine’s Symphony Preferred gained almost 100% over the same period. And because its returns were produced from the interaction of dozens of disparate return drivers applied across more than 100 global financial and commodity markets, Symphony Preferred’s event risk is much lower. In other words, poor performance for stocks does not mean Brandywine’s performance will suffer as well. In fact, some of Brandywine’s best performance has come during some of the worst-performing periods for stocks, as is illustrated in the following chart. This shows how Brandywine produced substantial profits at exactly the worst period for stocks over the past five years.


Graph 3

And Brandywine hasn’t just provided “tail risk” protection. Brandywine outperformed stocks over the entire period as well.


Graph 4

If it really is that simple, then why do so many people; individuals, professional investors, financial gurus, public pension plans – the list includes virtually every ‘investor’ – gamble their money in risky, stock-centric portfolios? The answers are numerous, and one of the best compilations of well-researched reasons can be found in Daniel Kahneman’s excellent book, Thinking Fast and Slow. But the very fact that people behave in irrational ways (we measure rationality as desiring to earn the most money with the least risk) is what allows so many under-exploited return drivers to exist and to be developed into profitable, and diversifying, trading strategies. That said, there are a few answers that stand out:

  1. All their friends are doing it. This is a cute way of saying that people define investment risk less by actual investment results and more by how different their results are compared to the “market.” In other words, reputational risk, or career risk, dominates true portfolio risk.
  2. They, themselves, are unable to uncover return drivers, other than those currently in the public domain (which are referred to as “beta,” or for those less well-known, “alternative beta”).
  3. They fear missing out on the returns they can get from holding stocks. It’s been banged into their heads that stocks outperform in the long-run and the best way to earn high returns is by putting money into stocks.

We can’t help with reason #1. If someone is truly more concerned with “fitting in” than making money, their affliction is outside of our domain expertise. But we can help with reasons #2 & #3. Over our 30+ years of investment research and trading, Brandywine has developed dozens of trading strategies based on numerous return drivers. These return drivers are generally obscure and not in the public domain. For example, where there might be thousands of academic papers and articles written about the long-term “risk premia” earned from buying-and-holding stocks, there is very little written about the return driver underlying the commodity markets strategy that produced the smoothed results in Graph 2. This is despite the fact that the commodity strategy is potentially even more soundly based. (We allude to the triviality of the “risk premia” construct is this past report).

When Radical is Rational
So what is a reasonable allocation to be made to long equity positions in a portfolio? For those who have bought into the conventional portfolio diversification advice, the correct answer – although quite logical – can appear radical and shocking. Let’s assume you are able to diversify your portfolio across 50 return drivers and 100+ markets. Everything else being equal, the allocation to a buy-and-hold strategy in stocks would approximate 1/50 of your portfolio allocation, or 2%. 

The fact that this allocation appears radical to most people is due to “reference” bias, not logic. If 60% is the reference point for an allocation to buying-and-holding stocks, any dramatic deviation from that level is “radical.” In addition, because people are battered with stories of how equities produce a positive return over time, they are blinded to both the existence of – and equal profit opportunities offered by – other return drivers. As a result, they are never presented (except in limited distribution reports such as this one) with research showing the true source of the returns driving markets. Without this understanding, they are constrained to gambling on a distinctly inferior, stock market dominated “Poor-folio.”

Your Move…
There is clearly a better way. When the next stock market decline occurs, wouldn’t you prefer to be invested in a program that has the ability to not only weather the storm, but, as demonstrated by the actual performance of Brandywine’s Symphony Preferred in Q3 2011, profit from it as well? We’re guessing that would be interesting. And if you could have that potential protection without giving up the ability to perform well during equity bull markets, would that increase your interest? Brandywine’s Symphony Preferred did just that. This report gave you a glimpse as to how and why.

If you’re intrigued and would like to learn more, please contact Rob Proctor, one of Brandywine’s principals, to have him take you through our online presentation. We look forward to helping you earn greater returns with less risk.

Footnotes:

(1) Past monthly reports that discussed the conventional bias towards holding long stock positions:
https://www.brandywine.com/pdf/monthly/BAM201302.pdf
https://www.brandywine.com/pdf/monthly/BAM201303.pdf
https://www.brandywine.com/pdf/monthly/BAM201304.pdf
https://www.brandywine.com/pdf/monthly/BAM201308.pdf
https://www.brandywine.com/pdf/monthly/BAM201401.pdf

(2) The two dominant return drivers powering stock prices are revealed in the opening chapter of Mr. Dever’s book, which you can read here: http://bit.ly/xrz2Ur

Share this post:
  • Facebook
  • Twitter
  • email
Permalink

The stark difference between mean-variance optimization and Brandywine’s “Predictive Diversification”

Originally published in the Brandywine Asset Management Monthly Report.

Milestone

Brandywine just completed our third full year of trading Brandywine’s Symphony Program. Prior to launching the Program in July 2011 we presented our performance expectations. It was our belief that our Return Driver based investment approach and Predictive Diversification portfolio allocation model would enable us to achieve those results with a reasonable level of confidence.

We are pleased to report that our performance has continued to track our expectations. Over the past three years Brandywine’s conservative Symphony Program has achieved a +7.31% annualized return with a Sharpe Ratio of 1.03 and our more aggressive Brandywine Symphony Preferred has produced a +28.26% annualized return with a Sharpe Ratio of 1.03. Each of these performances ranks Brandywine among the top investment managers on either a risk-adjusted or absolute return basis. But more importantly, these performances track right in line with expectations.

While every investment manager is required to disclose that PAST PERFORMANCE IS NOT INDICATIVE OF FUTURE RESULTS, Brandywine has devoted decades to understanding the aspects of investing that contribute to predictive performance. After all, if the past provides NO indication of future performance, then investing is not “investing” at all. It is gambling. In contrast to Brandywine; most academic research, and even many investment managers, focus on creating optimal portfolios – not predictive portfolios. There is an enormous philosophical and practical difference.

The stark difference between mean-variance optimization and Brandywine’s “Predictive Diversification”

Brandywine’s Symphony Program is the result of Brandywine’s 30+ years of investment research and trading. When Brandywine began the development of our Brandywine Benchmark program in the late 1980s, we recruited some top academics and finance practitioners to assist us in developing the portfolio allocation model. That model would manage how much capital to commit to each individual trading strategy and market in our portfolio.

In one test, we provided one academic researcher with performance data from more than ten strategies trading across dozens of markets. He returned with the allocation we were to make to each strategy/market combination. In short, a few strategy/market combinations were recommended to receive large allocations, while most were to receive no allocation at all. When we expressed our concern to the researcher that this concentrated portfolio was unlikely to perform well in the future (it didn’t pass the “sanity” check), his response was that what he provided to us was the “perfect” answer.

What we came to realize was that it was the perfect answer – but to the wrong question. The question the academics and our researchers had been answering was “how do I create the optimal portfolio?” – meaning one that displayed the best risk-adjusted returns on that past data. In contrast, the correct question should have been, “How do I create the most “predictable” portfolio?” – one where future performance will most closely match past performance (either tested or actual). After all, if you have low confidence that the results will repeat, then they are not really useful results at all – even if they are “optimal.” His answer was perfect ONLY if future data, i.e. future market fluctuations, were similar to past data – which of course we know is not going to be the case.

Surprisingly, there is very little (almost no) research on methods for producing the most predictable performance. Instead, decades of research have been wasted on answering the wrong question. Nobel Prizes have been awarded for it. Not surprisingly, people (and academics are people) will devote their efforts to answering the questions for which they receive the greatest reward. And for academics, the Nobel Prize is often perceived as the ultimate reward.

Not so with Brandywine. Our interest is in producing the best possible returns for our clients and us. The realization 25 years ago that we and others were asking the wrong question led to a significant amount of new research that resulted in Brandywine’s “Predictive Diversification” portfolio allocation model.

This model has withstood the test of time. First with the performance of our Brandywine Benchmark Program in the 1990s and continuing today with the performance of Brandywine’s Symphony Program. This model is predicated on the belief that the future will NOT be identical to the past. By solving for predictability, rather than optimizing on past returns, the model is better able to handle the natural changes in market conditions that are detrimental to optimized portfolios. The combination of our Return Driver based investment approach and Predictive Diversification portfolio allocation model is the reason that our actual performance has so closely matched our past performance. In addition to that (and somewhat ironically), Brandywine’s actual performance is more “optimal” (in both absolute and risk-adjusted terms) than portfolios that were constructed with the specific intent of being “optimal.”

The focus on allocation models designed to produce the most optimal performance on past data has only served to distract investors and managers from the most critical aspect of investing – ensuring that future performance tracks past performance as closely as possible. As a result of this focus, investment performance results appear to be random. The top managers over one period fail to perform over subsequent periods. While we most certainly cannot guarantee performance results, we can at least make the statement that Brandywine’s Symphony Program was developed with the prime directive of achieving the most predictable performance possible.

Share this post:
  • Facebook
  • Twitter
  • email
Permalink

Today’s Alpha is Tomorrow’s Beta

Originally published in the Brandywine Asset Management Monthly Report.

In last month’s report we wrote (playfully questioning) the “discovery” of momentum, value and liquidity as being valid Return Drivers affecting equity prices. Although these Return Drivers had not only been discovered decades before they subsequently became revealed by academics in the early 1990s, they had also been exploited for just as long by investors as varied as Warren Buffett, Richard Donchian and John Henry (among many, many others). In other words, these weren’t “discoveries” at all. We also pointed out that as soon as the mutual fund companies and other financial marketers discovered the appetite the public had for placing money in the new hot thing, they spun out numerous “Smart Beta” funds, which is the clever marketing title that’s been given to funds focusing on single strategies based on these Return Drivers.

In the mistaken belief that investors earn a return by assuming risks not desired to be held by others (as pointed out below, this is only one of many sources of return), these selectively discovered Return Drivers have been anointed as “risk factors.” They have earned a place alongside the “equity risk premium” and other academic constructs as being so well known that they have now became “beta” (or at least “smart beta”) and not the treasured “alpha” that creates excess returns.

In reality, we would contend returns have never been produced by beta. The performance of every market is based on one or more Return Drivers that are the source of the performance. Every Return Driver has a time period over which it is relevant (1). Once those Return Drivers have been discovered and understood, trading strategies can be developed to exploit those Return Drivers and profit by trading in the relevant markets affected by those Return Drivers. Momentum, value and liquidity are just three of many other Return Drivers that affect equity prices. Furthermore, risk transfer is only one of many sources of potential return. Profits are not only earned by collecting a “risk premium,” but they can also be earned by taking the other side of misguided, ill-informed or emotional positions that have been entered into by others.

There is No Alpha or Beta—Only Return Drivers
The field of behavioral finance is beginning to shed light on the fact that market returns are not simply a function of risk transfer but also caused by the inept behavior of people who are truly attempting to profit – but are incapable of making the correct decisions to do so. This is often not solely their fault. In our view many people are oblivious to the process required to invest correctly. They are seriously misled by the glut of misinformation published in the popular financial press and the reactionary behavior of gurus and other talking heads. In addition, they are poorly served by the academic constructs such as risk premium (which is merely a grandiose label given to a simple observation of past market behavior), and the massive attention placed on “diversifying” across “asset classes” (This will be the topic of a future report). As a result the vast majority of people will employ a gambling mentality that assures that over time they will transfer their money to more disciplined investors.

In contrast, it is only through a sound understanding of the valid Return Drivers that affect each market that a repeatable process for positive investment returns can be developed.

Brandywine’s Return Drivers
Over our 30+ year history of research and trading, Brandywine has developed and time-tested (with real money) a sizable number of Return Drivers. Many of these remain valid and are employed today. Although we have disclosed some of these Return Drivers (2), it would be adverse to our investment edge to reveal them all. In the parlance of the investment industry, to do so, over time, would convert the “alpha” generated by those strategies today into “smart beta” and ultimately just “beta,” at some point in the future.

To do that would violate the trust we have with our investors to protect their best interests. But without revealing the specific trading strategies, we can disclose some actual trades generated by them.

Trade Examples

Lean Hogs
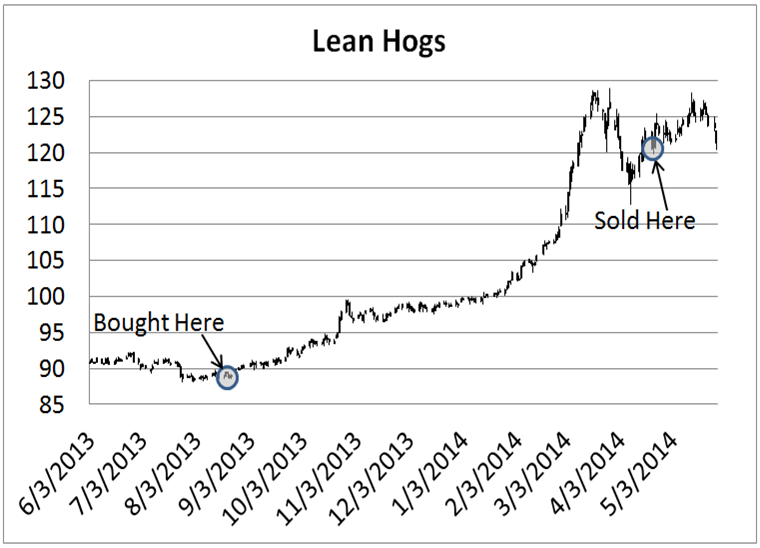
One strategy that provides a great illustration of the types of differentiating trades entered into by Brandywine’s Symphony Program is one based on U.S. livestock market fundamentals. It initiated a trade in the lean hog market near the lows reached in August 2013 and held that position until the market peak in April 2014. Brandywine, despite employing a fully systematic trading model, often enters into trades such as this that appear to be more “discretionary” than “systematic.”

S&P 500
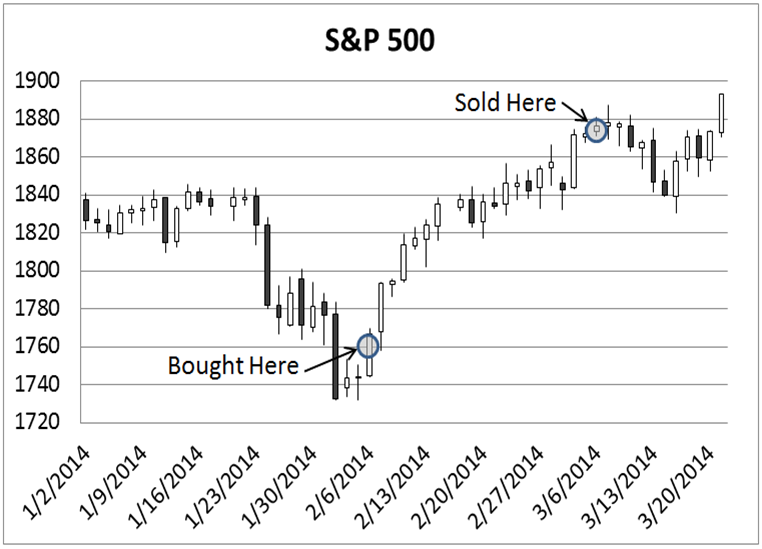
In Myth #3 of Mr. Dever’s book he presents examples of how people mis-time their trades by doing the opposite of what they should do (this is not a secret, Daniel Kahneman and Amos Tversky began research into such behavior in the 1970s). Brandywine incorporates a number of sentiment-based trading strategies to exploit this behavior across a wide range of markets. The trade below was based on one variation of a strategy disclosed by Mr. Dever in his book.

Balanced Diversification vs. Concentration. Discretionary vs. Systematic.
One key take-away from these trades, which is just a small sample of the many trades entered into by Brandywine in any given month, is that Brandywine is agnostic to the source of our returns. We don’t care whether they come from long positions in stock indexes or lean hogs, short positions in the Australian dollar, or a spread position in soybeans. As long as they are based on a sound, logical Return Driver, Brandywine will exploit these opportunities. Because of this, Brandywine’s trades often appear to be “discretionary” (based on an individual processing the data and deciding on a trade). In fact, however, while Brandywine employs significant discretion in the creation and development of its trading strategies, the application of those strategies in our actual trading is completely systematic.

The reason Brandywine employs a diversity of seemingly discretionary trading strategies in a fully systematic trading program is due to the result of extensive research Brandywine conducted beginning in the late 1980s. That research made clear that the most consistent and predictable returns are earned by systematically employing broad strategy and market diversification across a balanced portfolio of fundamental, Return Driver-based trading strategies. The key is to maintain balance across those Return Drivers and markets so that, over time, no single Return Driver or market will dominate performance.

As always, please reach out to us with any questions you may have.

(1) Exploiting the Myths: Profiting from Wall Street’s misguided beliefs (which became a Kindle best-seller under the popular title Jackass Investing: Don’t do it. Profit from it.); in the “takeaways” for Myth #1 on page 17.

(2) One strategy revealed in its entirety was designed to exploit people’s tendency to do the opposite of what they should do, as described in Myth #3 of Mr. Dever’s book. That strategy has contributed positively to Brandywine’s performance since it was introduced into the portfolio following its release to the public. A trade example in the S&P 500 from a variant of this strategy is displayed on the prior page.

Share this post:
  • Facebook
  • Twitter
  • email
Permalink

The Fallacy of Fama-French

Originally published in the Brandywine Asset Management Monthly Report.

In 1992 Eugene Fama and Kenneth French published a paper titled “The Cross-Section of Expected Stock Returns.” In that paper they introduced what has since become known as the “Fama-French three-factor model.” What they showed was that stock prices were driven not solely by a mystical “risk premium,” but that, in addition to beta, there were other factors that explained the movement of stock prices. In particular, the additional two “factors” they identified in their paper were that small capitalization and high value stocks outperformed other stocks. Over the years other academics expanded on the three-factor model by discovering that factors such as momentum and liquidity also affected equity prices.

The most shocking part of these discoveries was that they were considered “discoveries” at all. People have been using momentum to profitably trade markets for decades. Brandywine is aware of this first-hand. In the early 1980s Brandywine’s founder, Michael Dever, set up a fund to be traded by Richard Donchian, who first used momentum strategies in a fund he launched in 1949. (Mr. Donchian became known as the “father of trend following.”) And of course everyone knows about value investing, not the least because of Warren Buffett’s success in following the concepts first presented in 1934 by Benjamin Graham and David Dodd in their book Security Analysis.

In 1991, a year prior to the publication of the Fama-French three-factor model, Brandywine launched our Brandywine Benchmark program, which incorporated more than two-dozen return drivers (a return driver is the underlying condition that drives the price of a market, similar to a “factor”). These included some of the return drivers later discovered by academics, such as momentum and value. But rather than publish a paper and consider that to be the epitome of our research, Brandywine understood these were just two out of potentially hundreds of return drivers that could be exploited to profit from market movements. So Brandywine didn’t stop there. We not only developed numerous trading strategies based on additional distinct return drivers, but we also applied them to a diverse range of relevant global financial and commodity markets, not just stocks. As described in previous monthly reports, this approach has multiple benefits, including returns that are unrelated to those provided by “conventional” investments such as stocks and bonds (i), lower event risk (ii), and a greater likelihood that future returns will approximate past returns (iii).

Unfortunately for individual investors, however, the mutual fund industry has seized on the academic research, using it to provide cover for the creation of numerous mutual funds designed to capture specific factors. You can now put money into “smart beta” funds that pick stocks by value, size, momentum, liquidity, dividend history, earnings surprises, insider activity, sales growth, and a myriad of other specific factors. In an industry focused on selling the most recent “hot” fund, this serves the mutual fund companies well. But pumping out trivial “discoveries” in the form of alternative mutual funds and ETFs is a major disservice to investors.

Return Drivers & Performance Predictability
If there is one major takeaway from Brandywine’s research and trading over the past 35 years, it is that no single return driver (factor) such as these will provide either consistent or predictable returns. We don’t know of any legitimate trading strategy that will not have extended periods of significant drawdowns (relative to its prospective return). We realize people show performance of specific approaches that appear to be consistent and predictable, but at some point they will suffer multi-year losing spells. We also realize that people have back-tests of trading strategies that show consistent performance, but we can also assure you that they manufactured those results by sacrificing the future predictability of returns for that trading strategy.

But don’t confuse that with us saying that those return drivers are not worthy of serving as the basis for trading strategies. It just means that those return drivers should not be utilized on a stand-alone basis. Unfortunately, the investment industry does just that. It promotes the latest academic research as the “Holy Grail” of investing and people flood it with money.

We see the same focus on specific return drivers among institutional investors and their consultants. Recently for example, a large pension plan issued a mandate specifically for trend following CTAs. We agree that trend following is a valid return driver, but we take issue with the thinking behind the mandate. Their consultant had read research that showed the tail risk mitigation of having trend following CTAs in a portfolio. But that is a very simplistic conclusion. Trend following is just one return driver. There are many other return drivers that can provide that same benefit. And by combining trading strategies based on those other return drivers into a more diversified portfolio, they would get even better tail risk protection but with substantially greater predictability of performance.

We also see many institutional investors or funds-of-funds that are fixated on finding “specialist” managers that are uncorrelated with the core managers in their funds. The problem with this approach is that the past performance of a specialist manager has almost no predictive ability. Again, it doesn’t mean the return driver being captured by the specialist manager isn’t valid. It just means that it is not predictable.

Predictability is everything. There is no benefit in a great past performance record if it is not representative of future performance. In recognition of this, prior to the launch of the Brandywine Benchmark program in 1991, Brandywine conducted an extensive research project that focused on discovering the characteristics of a portfolio that contributed to producing predictable performance. This was a significantly different approach from that taken by virtually all other researchers then and now, who focus on developing portfolio allocation models that produce “optimal” performance. This research resulted in Brandywine’s “Predictive Diversification” portfolio allocation model. We came to realize during our research that to produce the most predictable returns, a portfolio must be balanced across a wide range of unrelated return drivers and markets.

Brandywine’s Symphony & Predictive Diversification
Brandywine expanded on this philosophy with the launch of Brandywine’s Symphony Program in 2011. Not only does Brandywine’s Symphony Program exploit many of the same return drivers first developed into trading strategies and incorporated into the Brandywine Benchmark program more than two decades ago, but it also takes advantage of more recent research to add trading strategies that were unavailable at that time. Mr. Dever discusses one of these strategies in chapter three of his best-seller and specifically in the Action Section for that chapter (pages 19-26) on the book’s web site.

Despite the continued proven success of Brandywine’s approach, we see little evidence in a stampede of like-minded followers committed to providing investment programs that are broadly diversified across both return drivers and markets. In fact, as described above, the opposite is occurring. Interest in specialist mutual funds and managers appears to be increasing.

While we at Brandywine are often frustrated with the archaic state of the investment industry and what passes for “research,” we are most concerned with the disservice it provides to individuals who are looking for answers on how to invest their money. That said, we also recognize that it is precisely this archaic state that provides us with our “edge.” To the extent that other managers dismiss return drivers, ignore opportunities in markets that are not featured regularly in the popular press or financial TV shows and instead focus on the “usual” suspects (stocks, bonds, gold), pursue specialty strategies to the exclusion of others that can improve the consistency and predictability of their returns, don’t understand the significance of predictive diversification, or are simply unable to devote the thought cycles to understanding and researching an approach that is so different from the conventional investment industry, we will benefit.

(i) Unrelated Returns:
Versus CTAs: https://www.brandywine.com/pdf/monthly/BAM201206.pdf
Versus Stocks: https://www.brandywine.com/pdf/monthly/BAM201303.pdf

(ii) Lower Event Risk:
https://www.brandywine.com/pdf/monthly/BAM201302.pdf

(iii) Predictability:
Diversification Leads to Predictability: https://www.brandywine.com/pdf/monthly/BAM201208.pdf
Fatal Flaw in Mean-Variance Optimization: https://www.brandywine.com/pdf/monthly/BAM201305.pdf
Predictive Diversification: https://www.brandywine.com/pdf/monthly/BAM201311.pdf

Share this post:
  • Facebook
  • Twitter
  • email
Permalink

Q & A with Brandywine

Originally published in the Brandywine Asset Management Monthly Report.

Over the past few decades Brandywine has built a reputation as being an innovator. While this has served us well from a performance-standpoint, it has often led to confusion when investors attempted to fit us into the investment manager categories they had created. For example, being systematic, as we are, often leads people to believe we must be a trend follower, which we are not. Or it leads to the assumption that we do not use fundamental information, which we do. Over the years we have accumulated our answers to some of the most common questions and compiled these into a rather extensive Q&A document. We thought we’d post some of those related to our trading and risk management philosophy in this month’s report:

Please provide your insight into the behavior of markets. What market inefficiencies do you attempt to capture and why are these inefficiencies exploitable?

Brandywine does not attempt to exploit any single market inefficiency. Each trading strategy is developed by Brandywine with the intent of capturing returns from a specific Return Driver. There are numerous biases in people’s behavior related to trading/investing/gambling, and Brandywine seeks to exploit those biases. (This philosophy led to Mr. Dever writing his book Exploiting the Myths: Profiting from Wall Street’s misguided beliefs (which became a best-seller under the popular title Jackass Investing).

These biases include the desire to “trade with the crowd,” anchoring biases, risk aversion, and numerous other behaviors and emotional responses that create inefficiencies that lead to the development of profitable trading strategies. These strategies provide excellent potential returns and diversification value in a ‘rationally-structured’ portfolio such as Brandywine’s. For example, in Myth #3 of Mr. Dever’s book, titled “You Can’t Time the Market,” Mr. Dever shows that precisely because the majority of people buy and sell U.S. equities at the wrong time, if you can measure this activity you can fade it for profit. In the Action Section for the book, he presents a specific trading strategy that does exactly this by measuring the money flows into and out of U.S. equity ETFs. Other trading strategies gain their edge by the fact that they are ‘hard’ to trade. For example, they may be subject to high volatility of returns. Many traders prefer strategies with low volatility and therefore ignore exploiting sound return drivers that result in positive and predictable returns over time if those returns are too volatile. These strategies provide excellent positive returns and diversification value in a portfolio such as Brandywine’s.

Are there any counterintuitive implications to risk management that you derived from your model?
 
Certainly, the determination in the late 1980s that mean-variance optimization of a portfolio was fatally flawed was the first major counter-intuitive outcome of our research, as that was the most highly-regarded and accepted portfolio allocation model of the time (and to a large extent remains so today).
 
Second, many potential investors we talked with at that time were convinced that each individual trading strategy within our model was required to be able to “stand on its own” with regards to its risk-adjusted returns. Brandywine determined that the only relevant question at the individual strategy level was if the strategy was based on a sound logical return driver likely to provide it with a positive return over time. This led us to develop and implement many trading strategies that were, and continue to be, unique to Brandywine.
 
Please elaborate on your risk management plan. Do you have specific limits on exposure to markets/sectors or is it possible that several different portfolio strategies may signal positions in the same market/sector?
 
Brandywine’s portfolio allocation model is designed to provide balance across each strategy and market traded in the portfolio. This is intended to ensure that, over time, each market makes an equal contribution to the portfolio’s risk.

Brandywine takes a very “top-down” approach to risk management and portfolio allocation. Our belief is that if a portfolio allocation model results in a significant overweight of a market or related (correlated) group of markets, that is a symptom of a flaw in that model. Mike Dever covered this topic specifically in his well-received presentation titled “The Fatal Flaw in Mean-Variance Optimization” at the QuantInvest conference in NYC in 2012. Many managers address the flaw in their portfolio allocation models by imposing market or sector constraints, essentially putting a band-aid on the wound created by an incorrect (damaging) portfolio allocation model. Brandywine’s goal when Mike Dever developed our portfolio allocation model in the late 1980s – early 1990s was to create a model that – first and foremost – produced future results that matched, as closely as possible, past results. As logical as that sounds, it was novel then and continues to remain novel today. Most managers base the success of their portfolio allocation / risk management models on how well they “optimize” returns on past data, not on how well future returns are likely to match those past returns. They start their research by asking the wrong question – (“How can I get the best results?”, rather than “How can I get the most predictable results?”). Many (most) managers make that initial critical mistake of optimization vs. predictability. We discussed our “Predictive Diversification” portfolio allocation model in our November 2013 monthly report.

In response to the specific question:
 
YES – several of the underlying trading strategies can pick the same contract or market, but
NO, by design the portfolio allocation model will not significantly overweight any market. However, because multiple trading strategies agree on a specific trade/position, there is a higher probability that will be a successful trade. Our portfolio allocation model then naturally allocates more to higher probability opportunities but within the construct that future performance will continue to match past performance. So in summary, we WANT to have heavier allocations to positions when multiple trading strategies are in agreement.

Share this post:
  • Facebook
  • Twitter
  • email
Permalink

The Value of Including Brandywine in Your Portfolio

Originally published in the Brandywine Asset Management Monthly Report.

The addition of Brandywine to a portfolio containing stocks or managed futures can both increase returns and decrease risk. This is clearly evident in the following two metrics.

First, performance: Since we launched Brandywine’s Symphony program in July 2011 it has gained +18.69% while both the BTOP 50 and Newedge managed futures indexes have fallen (-3.00% and -4.42%, respectively). Brandywine’s more aggressively managed Symphony Preferred gained +88.51%, outperforming the +49.33% earned by the S&P 500 total return index. Clearly, adding Brandywine to a portfolio that contains either managed futures or stocks would have increased returns.

Second, diversification value: Brandywine has made money when stocks or managed futures have lost. This, of course, is obvious when looking at Brandywine’s positive performance versus the losses in the managed futures indexes. But the same benefit is even more evident when comparing Brandywine to the S&P 500. For example, when the S&P 500 dropped -13.87% from July through September 2011, Brandywine’s Symphony Preferred gained +30.94%. So adding Brandywine to a portfolio that contains either managed futures or stocks would also have decreased drawdowns (risk).

Looking at our results, the diversification value of including Brandywine in an investment portfolio is obvious. This value has not gone unnoticed, as is evidenced by our growth in assets and interest from new investors. That said, some of the conventional metrics used by asset allocators not only disguise this value, but actually lead uninformed investors to reach the exact opposite conclusion.

The Abuse of Correlation (Part 2)

In our January 2013 report we discussed how correlation metrics are easily and often abused by investors. In this report, we’ll give a further example of why correlation statistics can be misleading at best, dangerous at worst, or even downright ridiculous.

Newedge publishes statistical reports on a number of investment managers, including Brandywine. One of the measures they provide is the correlation of monthly returns between Brandywine’s Symphony program and the Newedge CTA index. The correlation data is what you would expect from looking at Brandywine’s differentiating performance over the past few years. In both up and down months for the Newedge Index, Brandywine’s correlation to the index has been less than 0.1 (meaning there is no correlation of returns). However, despite Brandywine’s strong out-performance, (the result of our use of innovations such as Return Drivers and Predictive Diversification) and obvious portfolio diversification value, it is possible that some investors could exclude Brandywine from their portfolio because they consider us too correlated to the other investments they hold.

Let’s take a look at why.

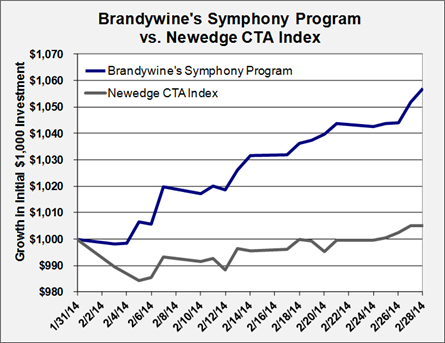
The chart below shows the performance of Brandywine’s Symphony program compared with that of the Newedge managed futures index during February. Clearly, Brandywine’s consistent profits throughout the month and strongly positive return of +5.70% were highly dissimilar to the underperformance recorded by the Newedge index. This simple chart makes it clear that there’s no question that including Brandywine in the portfolio would have added significant value during the month.

But during February, Brandywine’s correlation of daily returns to the Newedge Index increased significantly, recording a value of +0.62 during the month. Sure, there were some days where the Newedge Index posted a gain and Brandywine did as well (who wouldn’t want that?). But of the nine days when the Newedge index fell, Brandywine gained in five of them. And Brandywine didn’t outperform by taking on more leverage; both Brandywine and the Newedge index posted an identical 42 basis point standard deviation of daily returns. This is exactly the kind of diversification value you want to see in a manager. Yet someone focused on the daily correlation metric would have concluded that Brandywine provided little diversification value – the correlation was too high. This is a clear example of where a reliance on correlation proves dangerous to an investor’s financial well-being.

Now let’s move from dangerous to ridiculous.

For most of the month of February, the Newedge index was showing a loss. Had the month ended that way, you would expect that the already low 0.09 correlation between Brandywine and Newedge during down months of the Newedge Index would have collapsed, or even gone negative. After all, Brandywine was up a sizable amount and the Newedge Index was showing a loss. But perversely, that’s just not so. In fact, had the month ended on February 20th, at which time the Newedge index showed a -0.5% loss and Brandywine’s Symphony program showed a +4.0% profit, the correlation of monthly returns during down months of the Newedge index would have increased from 0.09 to 0.24! Despite the stark contrast in our performances, an investor relying on the correlation metric would have concluded there was a decrease in the diversification value provided by Brandywine!

But it gets even more ridiculous. Had Brandywine performed the exact opposite on a daily basis as it had in February [had we lost -5.70% rather than gained +5.70%], our daily correlation would have measured -0.62. This would have made Brandywine more attractive to an investor focused on correlation than did our actual significant positive performance!

When it comes to correlation, sometimes it’s better to lose than to win.

The Need to Understand Return Drivers

This makes clear the serious shortcoming in using correlation to find managers that can add diversification value to a portfolio. The real problem is that correlation tells you nothing about the “true” diversification value inherent in a manager’s trading. True diversification value (as well as true risk, a topic for another report) can only be determined with an understanding of the Return Drivers powering the manager’s performance.

Because of this, Brandywine has been more open than most managers in revealing the sources of our returns. In fact, we have openly presented one of our actual trading strategies on the Web (and at the end of this narrative, we provide links to our past monthly reports* where we discussed some of our trading strategies and their primary Return Drivers). We realize that many managers, who may only have a single Return Driver underlying their trading strategies, are necessarily more opaque and unwilling to divulge their single secret. This is what forces investors to revert to using proxies such as correlation in place of understanding the actual Return Drivers. But because of the inability of correlation to provide any reasonably useful information, if the ability exists to understand the underlying Return Drivers, correlation should be discarded as a measure.

*Brandywine’s Monthly Reports where we discussed specific trading strategies: 2011-08, 2011-09, 2011-10, 2012-06, 2012-08, 2013-09

Share this post:
  • Facebook
  • Twitter
  • email
Permalink

The Stock Fixation

Originally published in the Brandywine Asset Management Monthly Report.

Last month, Mike Dever published an article titled “The Future Returns from Stocks and Bonds” that used simple math to establish a price level (and total return) for stocks and bonds at the end of this decade. It wasn’t the result of his research that we found the most interesting (but if you want to see why the S&P 500 is projected to be lower at the end of the decade than it was at year-end 2013, you can read the article here), it was the comments we received from readers of the article. There was one comment that epitomized the gambling mentality of the average “investor.” In referring to those pundits who have been incorrectly predicting a decline in stock prices ever since the financial crisis, he wrote: “Anybody that listened to them for the past five years is in a world of hurt.”

We’re not arguing those pundits weren’t wrong. Clearly, stocks rallied sharply throughout that period. But it shouldn’t have mattered significantly. Here’s how Mr. Dever’s response summed up the core investment philosophy underlying Brandywine’s trading:

“If a 12-year (as of five years ago) projection of what returns would be earned by passively putting money into the S&P 500 has a significant impact on the performance of a person’s portfolio – if it resulted in them being in a “world of hurt” if they were wrong – then they’re not an investor. They’re a gambler. They have far too much riding on one single decision.

The performance of the S&P 500 should have no greater impact on the performance of a person’s portfolio than that of the sugar market, or dollar, or Korean stocks or any number of the hundred plus other active global financial and commodity markets. There are legitimate Return Drivers that can be exploited to profit from trading in those markets as certainly as there are Return Drivers to be exploited to profit from trading in the S&P 500.”

The “world of hurt” comment points out the fixation people have on owning stocks as a major portion of their investment portfolio and it continues to amaze us as to how many people continue to bet their savings on a single Return Driver. As Mike Dever shows in the opening chapter of Exploiting the Myths (also released under the best-selling title Jackass Investing), in periods of less than 20 years, stock market prices are dominated by investor sentiment. It is gambling to bet a substantial portion of a portfolio on that single Return Driver.

From the standpoint of seeking the greatest returns while being exposed to the lowest risk of achieving those returns, any of the 100+ actively traded global financial and commodity markets should be just as important to investors as the U.S. stock market. Yet there is virtually no discussion among investors about Australian bonds, coffee prices, or sugar – while the stock market dominates the news. Why isn’t there a C(offee)NBC discussing freeze potential, new export markets, diseases affecting the coffee crop, etc.? For the reason that not enough people care. Because stocks dominate the financial news, people buy stocks. Because people buy stocks, the financial media panders to that exposure.

The result is a gambling mentality – where the price activity of a single market dominates a person’s wealth. The financial media and professionals promise safety and diversification, but deliver roulette. You are not constrained by this mentality. You don’t need to gamble on stock market event risk to earn stock market returns. In fact, by diversifying across Return Drivers you can target even higher returns while also reducing risk. This is the basis of true portfolio diversification. Its effectiveness is evidenced by the performance of Brandywine’s Symphony Preferred, which has not only outperformed stocks over the strong bull market of the past few years, but also gained in January when stocks fell globally.

Please feel free to contact Rob Proctor at rob@brandywine.com if you would like to learn more about Brandywine’s Return Driver based investment philosophy and our approach to true portfolio diversification.

Share this post:
  • Facebook
  • Twitter
  • email
Permalink

Future Returns from Stocks and Bonds

This is an update to the article I wrote in mid-2013 that projected the future returns to be earned from stocks and bonds through the remainder of this decade. The article was based on research I conducted in writing my best-selling book, Jackass Investing: Don’t do it. Profit from it [i] .

Unfortunately, for people intent on adhering to a conventional 60-40 portfolio, or gambling [ii] their returns on placing money primarily in stocks, future returns do not look promising. The projected returns are lower than most people anticipate for two primary reasons:

  • The stock market rally that has taken place over the past few years has dramatically increased the multiple that people are now paying for stocks and unless “this time is different” has the effect of reducing today’s future return potential, and
  • Current profit margins have expanded to a level that is well above their long-term average. Unless “this time is different” a return to a more normal level will serve as a drag on profits over the remainder of this decade.

But before we get into the basis for my projection, let’s take a look at the three primary return drivers that power stock market returns. I outline these in the first two chapters [iii] of my book:

  1. Corporate earnings growth
  2. Investor sentiment
  3. Dividends

Now I’ll show how each of these returns drivers is projected to contribute to the future returns from stocks.

Return contribution from corporate earnings growth

Since 1900, earnings growth for companies in the S&P 500 (and its predecessor indexes) has averaged 4.73% [iv] . Because we use a 10-year average of earnings (as described in the next section) to calculate the likely level of stocks at the end of the decade, the effect of dropping off the poor earnings during the financial crisis has the effect of increasing the real 10-year average earnings growth rate over the remainder of this decade to above this level. For example, if profit margins remain at today’s level, earnings will grow at 7.19% from year-end 2013 to year-end 2020.

Unfortunately for future returns however, today’s profit margins are a fair amount above the longer-term average. Depending on the time period measured and companies included in the measurement, a ‘normal’ profit margin is approximately 7% [v] , while today’s profit margin on the S&P 500 is in the range of 9.5% [vi] . There are a number of factors that have contributed to today’s higher profit margins, among them low interest rates, constrained payroll costs and capital expenditures, and increased profits (and lower taxes) derived from non-US business. And there are those who contend that these changes are structural and will persist. Perhaps. But to accept this is to believe that “this time is different.”

As a result, I believe that profit margins are likely to decline to the longer-term average of 7% by year-end 2020. As profit margins revert towards their long-term average, earnings growth will be subdued. To expect something different is betting against the odds. The result is that corporate profits on the S&P 500 are likely to grow at a 5.53% annual rate.

Return contribution from investor sentiment

In my book I show that investor sentiment is the dominant return driver for stocks during periods of less than 20 years. Perhaps surprisingly, today, less than five years after the dramatic losses suffered by the world’s stock markets during the financial crisis, investor sentiment is approaching historical highs. This is evident in a variety of indicators, such as investor surveys [vii] and stock fund inflows [viii] . But the measure we use, which confirms the optimism exhibited by these other measures, is the cyclically-adjusted price-earnings ratio (“CAPE”).

CAPE was popularized by Robert Shiller in his book Irrational Exuberance and compares the S&P 500’s current price to the 10-year average of earnings. This has the benefit of smoothing earnings to reduce the impact of interim events, such as the financial crisis. Over the past 114 years CAPE has averaged 16.45. As of year-end 2013, due to the strong stock market rally of the past few years, CAPE has inflated to 25.09.

Unless “this time is different,” to believe that CAPE will remain at a new “permanently high plateau [ix] ” is to bet against the odds. Over the remainder of this decade CAPE is more likely to revert to its long-term average. The result will be an annual drag on stock market appreciation of -5.85% [x] .

Return contribution from dividends

The dividend yield on the S&P 500 at year-end 2013 was approximately 1.91%. This represents a dividend payout ratio of 37%. This payout ratio is quite a bit lower than the 114 year average of 59%. If the payout ratio reverts to its long-term average, this will boost the dividend yield over the remainder of this decade. As a result of this, and assuming that dividends compound this effect while also increasing along with corporate profits, I project the annual return contribution from dividends, between 2013 and the end of 2020, will be +2.62%.

Calculating the S&P 500 total return

We’re now left with a calculation to determine the projected average annual return for the S&P total return index, between year-end 2013 and year-end 2020.

This is the sum of the contribution from each of the three return drivers:

This performance is dramatically lower than what conventional investment wisdom has led people to expect. Even if profit margins remain at today’s high levels, the total return from stocks will be, at 4.3%, only half of what people have come to expect. The math is rather straightforward. To expect a different result than what is shown here is to insist that “this time is different.”

Return contribution from bonds

For the past 32 years the Barclay Aggregate Bond Index averaged annualized returns of 8.46%. Unfortunately, the two primary return drivers that contributed to that performance, although more favorable since I wrote my original article, are both destined to provide much lower returns in the future. They are:

  1. The capital appreciation provided as the high interest rate of 13% that prevailed at the start of the period declined to 1.75% today, [xi] and
  2. The average yield of 5.79% (on the 5-year Treasury note, which approximates the yield on the Index) over the period.

With the Barclay Aggregate Bond Index now yielding just over 2%, the likely return from bonds over the remainder of this decade (based on the fact that historically, the yield on the Barclay Aggregate Bond Index is predictive of total returns over the following 5-10 years) should be similar to the current yield on the Barclay Aggregate Bond Index, which, as represented by the iShares ETF (AGG) is 2.32%. To believe otherwise would be to believe that “this time is different.”

Calculating the return on the 60-40 portfolio

In summary then, based on the above straightforward analysis, from year-end 2013 through year-end 2020 we can expect the following return from a conventional 60-40 portfolio:

This is obviously much lower than what people have come to expect from a conventionally-diversified portfolio. It is also likely insufficient to meet most people’s financial needs. This doesn’t mean stocks couldn’t go up 30% again in 2014. They could. But they could also drop 30%. In fact, the lower projected return does not mean lower volatility. History shows that during periods with similar CAPE levels as today, volatility has actually been higher than normal [xii] . So while we’re looking at low returns over the next seven years, we’re also looking at above average volatility of those low returns. Clearly, this is a sub-optimal environment in which to entrust your money to a 60-40 “poor-folio.”

But this is not a unique situation. Conventional investment wisdom has always encouraged gambling, rather than investing. Due to its reliance on just four return drivers, the conventional 60-40 portfolio has never provided true portfolio diversification and has always exposed people to unnecessary risks relative to the potential return (my definition of “Jackass Investing”). When those four return drivers underperform, as is indicated by the projections in this article, performance will suffer, but the risks remain. The dramatic losses in 2001 and 2008 should serve as a warning. They are not exceptions.

But there is a better way.

Increasing returns and reducing risk with Return Driver based investing

Portfolio diversification is the one true “free lunch” of investing, where you can achieve both greater returns and less risk. But “true” portfolio diversification can only be obtained by diversifying your portfolio across multiple return drivers [xiii] . I give examples of a truly diversified portfolio in the final chapter [xiv] of my book, and I am pleased to provide a complimentary link to that chapter here: Myth 20. While some people may prefer to gamble on a less-diversified 60-40 portfolio, as my book shows, in the longer-term, true portfolio diversification can lead to both increased returns and reduced risk. And especially today, the odds do not favor a 60-40 gambling approach.

____________________________________________________________________

[i] Learn more about the book at www.JackassInvesting.com .

[ii] I refer to holding heavy positions in stocks as “gambling” Because people that do so are taking unnecessary risks with their money (meaning they could earn the same returns with less risk if they properly diversified their portfolios). You can read the chapter on gambling vs. investing here: http://bit.ly/utWsNy

[iii] I have made available complimentary eBook versions of the Introduction and first two chapters of my best-seller at the following links: http://tinyurl.com/qxt8e2h and http://bit.ly/xW2xuS

[iv] Robert J. Shiller, Irrational Exuberance (Princeton: Princeton University Press, 2000, 2005 updated). Data provided from a spreadsheet available at http://www.irrationalexuberance.com/

[v] David Bianco, “Deutsche Bank Securities Inc. US Equity insights,” December 12, 2013, pg. 72.

[vi] S&P reports profit margins on the S&P 500 as of June 2013 at 9.5%. Available under “Additional info, then “Index Earnings” at http://us.spindices.com/indices/equity/sp-500

[vii] The Investors Intelligence survey of December 17, 2013 shows more than four times as many bulls as bears. This is one of the highest readings in the history of the indicator and is greater than the ratio at both the 2000 and 2007 market peaks. Historically, measures greater than three are indicative of market tops.

[viii] I present an actual trading strategy based on stock fund money flows in the “Action Section” for Jackass investing). You can read about the trading strategy starting on page 19 of the Action Section at: https://jackassinvesting.com/action/index.php.

[ix] This was the famous quote pronounced by the noted economist Irving Fisher immediately prior to the stock market crash of 1929, when he stated that the stock market had reached “a permanently high plateau.” His reputation never recovered from that gaffe.

[x] If CAPE today was equal to its long-term average the S&P500 would be at 1192, a 34.45% decline from the year-end 2013 price of 1818. This equates to an annualized decline of 5.85%.

[xi] This was the rate on the 5 year U.S. government bond. Five years is used as that is the approximate average duration of the Barclay Aggregate Bond Index.

[xii] Shiller calculates that the forward three year volatility of S&P 500 is 15.55% when CAPE>=25 and 12.77% when CAPE<25.

[xiii] I discuss returns drivers in the Introduction to my book, which you can read here: http://tinyurl.com/q3eu7qm

[xiv] I have made available a complimentary eBook version of the final chapter of my best-seller at the following link: http://bit.ly/vxDo6v


Share this post:
  • Facebook
  • Twitter
  • email
Permalink